

The Economics of Desertification, Land Degradation, and Drought
The Economics of Desertification, Land Degradation, and Drought
The Economics of Desertification, Land Degradation, and Drought

You also want an ePaper? Increase the reach of your titles
YUMPU automatically turns print PDFs into web optimized ePapers that Google loves.
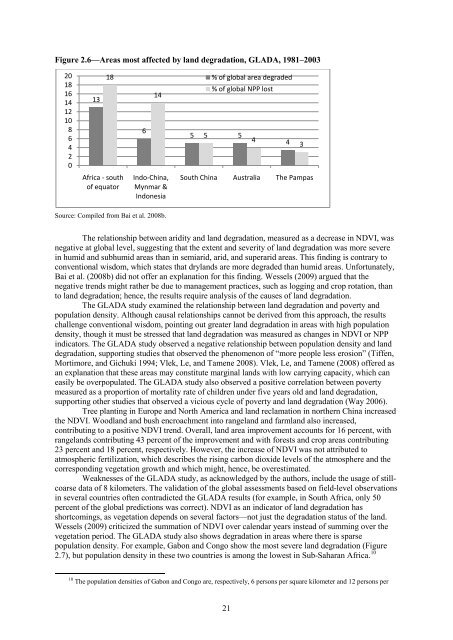
Figure 2.6—Areas most affected by l<strong>and</strong> degradation, GLADA, 1981–2003<br />
20<br />
18<br />
16<br />
14<br />
12<br />
10<br />
8<br />
6<br />
4<br />
2<br />
0<br />
13<br />
18<br />
Africa - south<br />
<strong>of</strong> equator<br />
Source: Compiled from Bai et al. 2008b.<br />
6<br />
14<br />
Indo-China,<br />
Mynmar &<br />
Indonesia<br />
% <strong>of</strong> global area degraded<br />
% <strong>of</strong> global NPP lost<br />
5 5 5<br />
South China Australia <strong>The</strong> Pampas<br />
<strong>The</strong> relationship between aridity <strong>and</strong> l<strong>and</strong> degradation, measured as a decrease in NDVI, was<br />
negative at global level, suggesting that the extent <strong>and</strong> severity <strong>of</strong> l<strong>and</strong> degradation was more severe<br />
in humid <strong>and</strong> subhumid areas than in semiarid, arid, <strong>and</strong> superarid areas. This finding is contrary to<br />
conventional wisdom, which states that dryl<strong>and</strong>s are more degraded than humid areas. Unfortunately,<br />
Bai et al. (2008b) did not <strong>of</strong>fer an explanation for this finding. Wessels (2009) argued that the<br />
negative trends might rather be due to management practices, such as logging <strong>and</strong> crop rotation, than<br />
to l<strong>and</strong> degradation; hence, the results require analysis <strong>of</strong> the causes <strong>of</strong> l<strong>and</strong> degradation.<br />
<strong>The</strong> GLADA study examined the relationship between l<strong>and</strong> degradation <strong>and</strong> poverty <strong>and</strong><br />
population density. Although causal relationships cannot be derived from this approach, the results<br />
challenge conventional wisdom, pointing out greater l<strong>and</strong> degradation in areas with high population<br />
density, though it must be stressed that l<strong>and</strong> degradation was measured as changes in NDVI or NPP<br />
indicators. <strong>The</strong> GLADA study observed a negative relationship between population density <strong>and</strong> l<strong>and</strong><br />
degradation, supporting studies that observed the phenomenon <strong>of</strong> “more people less erosion” (Tiffen,<br />
Mortimore, <strong>and</strong> Gichuki 1994; Vlek, Le, <strong>and</strong> Tamene 2008). Vlek, Le, <strong>and</strong> Tamene (2008) <strong>of</strong>fered as<br />
an explanation that these areas may constitute marginal l<strong>and</strong>s with low carrying capacity, which can<br />
easily be overpopulated. <strong>The</strong> GLADA study also observed a positive correlation between poverty<br />
measured as a proportion <strong>of</strong> mortality rate <strong>of</strong> children under five years old <strong>and</strong> l<strong>and</strong> degradation,<br />
supporting other studies that observed a vicious cycle <strong>of</strong> poverty <strong>and</strong> l<strong>and</strong> degradation (Way 2006).<br />
Tree planting in Europe <strong>and</strong> North America <strong>and</strong> l<strong>and</strong> reclamation in northern China increased<br />
the NDVI. Woodl<strong>and</strong> <strong>and</strong> bush encroachment into rangel<strong>and</strong> <strong>and</strong> farml<strong>and</strong> also increased,<br />
contributing to a positive NDVI trend. Overall, l<strong>and</strong> area improvement accounts for 16 percent, with<br />
rangel<strong>and</strong>s contributing 43 percent <strong>of</strong> the improvement <strong>and</strong> with forests <strong>and</strong> crop areas contributing<br />
23 percent <strong>and</strong> 18 percent, respectively. However, the increase <strong>of</strong> NDVI was not attributed to<br />
atmospheric fertilization, which describes the rising carbon dioxide levels <strong>of</strong> the atmosphere <strong>and</strong> the<br />
corresponding vegetation growth <strong>and</strong> which might, hence, be overestimated.<br />
Weaknesses <strong>of</strong> the GLADA study, as acknowledged by the authors, include the usage <strong>of</strong> stillcoarse<br />
data <strong>of</strong> 8 kilometers. <strong>The</strong> validation <strong>of</strong> the global assessments based on field-level observations<br />
in several countries <strong>of</strong>ten contradicted the GLADA results (for example, in South Africa, only 50<br />
percent <strong>of</strong> the global predictions was correct). NDVI as an indicator <strong>of</strong> l<strong>and</strong> degradation has<br />
shortcomings, as vegetation depends on several factors—not just the degradation status <strong>of</strong> the l<strong>and</strong>.<br />
Wessels (2009) criticized the summation <strong>of</strong> NDVI over calendar years instead <strong>of</strong> summing over the<br />
vegetation period. <strong>The</strong> GLADA study also shows degradation in areas where there is sparse<br />
population density. For example, Gabon <strong>and</strong> Congo show the most severe l<strong>and</strong> degradation (Figure<br />
2.7), but population density in these two countries is among the lowest in Sub-Saharan Africa. 10<br />
10 <strong>The</strong> population densities <strong>of</strong> Gabon <strong>and</strong> Congo are, respectively, 6 persons per square kilometer <strong>and</strong> 12 persons per<br />
21<br />
4<br />
4<br />
3<br />
.


