

Preliminary-Blueprint-Eng
Preliminary-Blueprint-Eng
Preliminary-Blueprint-Eng

You also want an ePaper? Increase the reach of your titles
YUMPU automatically turns print PDFs into web optimized ePapers that Google loves.
ole) in 25 years. Nonetheless, this progression is still primarily tenurebased<br />
which may reduce incentives for teachers to constantly develop<br />
themselves. Further, a 25 year promotion timeframe is still relatively<br />
long and will not address the current challenge wherein there are<br />
insufficient senior teachers to coach new teachers as they enter the<br />
system. 58% of teachers are still at the lowest grade level of DG41 or<br />
DG29, as compared to 1.2% at DG52 or DGA34 (Exhibit 5-9).<br />
Another challenge to effective career progression is that the primary<br />
instrument used in teacher evaluations, the Annual Performance<br />
Report or Laporan Nilaian Prestasi Tahunan (LNPT) is not tied to<br />
specific teaching competencies, such as subject knowledge and the<br />
mastery of a range of teaching strategies. As the LNPT is the same<br />
instrument used for all civil servants, its evaluation dimensions are<br />
relatively generic and do not lend themselves well to performance<br />
differentiation. In a 2010 sampling of approximately 48,000 teachers,<br />
more than 60% of respondents were graded above 90%, while a further<br />
38% scored between 70% and 90%. 2% of respondents were graded<br />
below 70%. This lack of differentiation does not allow the Ministry to<br />
provide targeted support to those who need it.<br />
EXHIBIT 5-9<br />
Distribution of teachers by grade level<br />
Percentage of teachers, 2012<br />
DGA34, DG 52 1.2%<br />
DG48 1.6%<br />
DGA32, DG44<br />
39%<br />
DGA29, DG41 or equivalent<br />
58%<br />
SOURCE: Human Resource Management Division<br />
JUSA 0.01%<br />
DGA38, DG54 0.2%<br />
N = 410,000<br />
To counter this shortfall, the Ministry has developed other instruments<br />
to support the evaluation process. However, this solution has<br />
inadvertently created some confusion among teachers as to which<br />
dimension or criteria really matter. Teachers have also raised concerns<br />
that this duplication becomes a waste of time and resources.<br />
Malaysia Education <strong>Blueprint</strong> 2013 - 2025<br />
Chapter 5 Teachers and School Leaders<br />
Image by Poetprince, Flickr CC 2.0<br />
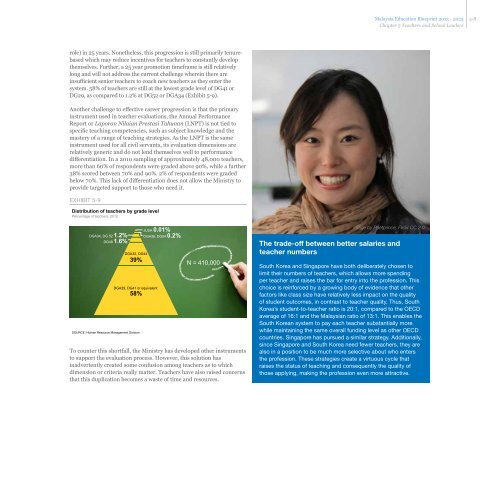
The trade-off between better salaries and<br />
teacher numbers<br />
South Korea and Singapore have both deliberately chosen to<br />
limit their numbers of teachers, which allows more spending<br />
per teacher and raises the bar for entry into the profession. This<br />
choice is reinforced by a growing body of evidence that other<br />
factors like class size have relatively less impact on the quality<br />
of student outcomes, in contrast to teacher quality. Thus, South<br />
Korea’s student-to-teacher ratio is 20:1, compared to the OECD<br />
average of 16:1 and the Malaysian ratio of 13:1. This enables the<br />
South Korean system to pay each teacher substantially more<br />
while maintaining the same overall funding level as other OECD<br />
countries. Singapore has pursued a similar strategy. Additionally,<br />
since Singapore and South Korea need fewer teachers, they are<br />
also in a position to be much more selective about who enters<br />
the profession. These strategies create a virtuous cycle that<br />
raises the status of teaching and consequently the quality of<br />
those applying, making the profession even more attractive.<br />
5-8