

Preliminary-Blueprint-Eng
Preliminary-Blueprint-Eng
Preliminary-Blueprint-Eng

You also want an ePaper? Increase the reach of your titles
YUMPU automatically turns print PDFs into web optimized ePapers that Google loves.
3-11<br />
▪ In Science, students are able to identify, explain and apply<br />
scientific knowledge in a variety of complex life situations.<br />
They consistently demonstrate advanced scientific thinking and<br />
reasoning. Students are able to use scientific knowledge and develop<br />
arguments in support of recommendations and decisions that centre<br />
on personal, social, or global situations.<br />
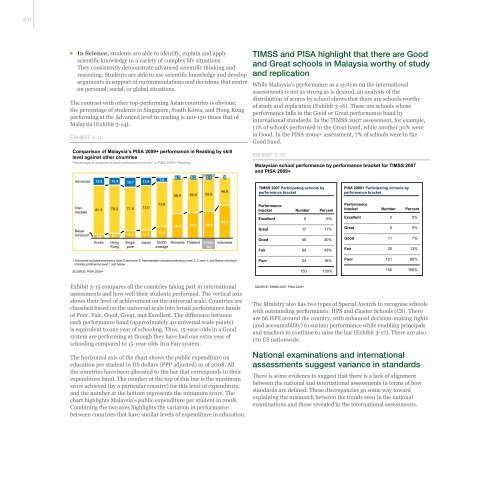
The contrast with other top-performing Asian countries is obvious:<br />
the percentage of students in Singapore, South Korea, and Hong Kong<br />
performing at the Advanced level in reading is 120-150 times that of<br />
Malaysia (Exhibit 3-14).<br />
EXHIBIT 3-14<br />
Comparison of Malaysia’s PISA 2009+ performance in Reading by skill<br />
level against other countries<br />
Percentage of students at each performance levels 1 in PISA 2009+ Reading<br />
Advanced<br />
Intermediate<br />
Below<br />
minimum<br />
12.9<br />
13.4<br />
81.3 79.3 71.8 73.0<br />
5.8<br />
Korea<br />
12.4<br />
8.3<br />
Hong<br />
Kong<br />
15.7<br />
12.5<br />
Singapore<br />
13.6<br />
Japan<br />
7.6<br />
73.6<br />
18.8<br />
OECD<br />
average<br />
0.7<br />
0.3<br />
0.1<br />
58.9 56.8 55.9<br />
40.4<br />
42.9<br />
Romania Thailand<br />
44.0<br />
Malaysia<br />
0<br />
46.6<br />
53.4<br />
Indonesia<br />
1 Advanced includes proficiency level 5 and level 6; Intermediate includes proficiency level 2, 3, and 4; and Below minimum<br />
includes proficiency level 1 and below<br />
SOURCE: PISA 2009+<br />
Exhibit 3-15 compares all the countries taking part in international<br />
assessments and how well their students performed. The vertical axis<br />
shows their level of achievement on the universal scale. Countries are<br />
classified based on the universal scale into broad performance bands<br />
of Poor, Fair, Good, Great, and Excellent. The difference between<br />
each performance band (approximately 40 universal scale points)<br />
is equivalent to one year of schooling. Thus, 15-year-olds in a Good<br />
system are performing as though they have had one extra year of<br />
schooling compared to 15-year-olds in a Fair system.<br />
The horizontal axis of the chart shows the public expenditure on<br />
education per student in US dollars (PPP adjusted) as of 2008. All<br />
the countries have been allocated to the bar that corresponds to their<br />
expenditure band. The number at the top of this bar is the maximum<br />
score achieved (by a particular country) for this level of expenditure,<br />
and the number at the bottom represents the minimum score. The<br />
chart highlights Malaysia’s public expenditure per student in 2008.<br />
Combining the two axes highlights the variation in performance<br />
between countries that have similar levels of expenditure in education.<br />
TIMSS and PISA highlight that there are Good<br />
and Great schools in Malaysia worthy of study<br />
and replication<br />
While Malaysia’s performance as a system on the international<br />
assessments is not as strong as is desired, an analysis of the<br />
distribution of scores by school shows that there are schools worthy<br />
of study and replication (Exhibit 3-16). These are schools whose<br />
performance falls in the Good or Great performance band by<br />
international standards. In the TIMSS 2007 assessment, for example,<br />
11% of schools performed in the Great band, while another 30% were<br />
in Good. In the PISA 2009+ assessment, 7% of schools were in the<br />
Good band.<br />
EXHIBIT 3-16<br />
Malaysian school performance by performance bracket for TIMSS 2007<br />
and PISA 2009+<br />
TIMSS 2007 Participating schools by<br />
performance bracket<br />
Performance<br />
bracket<br />
Number Percent<br />
Excellent 0 0%<br />
Great<br />
Good<br />
Fair<br />
Poor<br />
SOURCE: TIMSS 2007; PISA 2009+<br />
17<br />
45<br />
64<br />
24<br />
11%<br />
30%<br />
43%<br />
16%<br />
150 100%<br />
PISA 2009+ Participating schools by<br />
performance bracket<br />
Performance<br />
bracket<br />
Number Percent<br />
Excellent 0 0%<br />
Great<br />
Good<br />
Fair<br />
Poor<br />
0<br />
11<br />
20<br />
121<br />
0%<br />
7%<br />
13%<br />
80%<br />
152 100%<br />
The Ministry also has two types of Special Awards to recognise schools<br />
with outstanding performance: HPS and Cluster Schools (CS). There<br />
are 66 HPS around the country, with enhanced decision-making rights<br />
(and accountability) to sustain performance while enabling principals<br />
and teachers to continue to raise the bar (Exhibit 3-17). There are also<br />
170 CS nationwide.<br />
National examinations and international<br />
assessments suggest variance in standards<br />
There is some evidence to suggest that there is a lack of alignment<br />
between the national and international assessments in terms of how<br />
standards are defined. These discrepancies go some way toward<br />
explaining the mismatch between the trends seen in the national<br />
examinations and those revealed in the international assessments.