

Preliminary-Blueprint-Eng
Preliminary-Blueprint-Eng
Preliminary-Blueprint-Eng

Create successful ePaper yourself
Turn your PDF publications into a flip-book with our unique Google optimized e-Paper software.
» National student survey: to understand students’ perceptions<br />
of their education and classroom experience, as well as their<br />
language proficiency. Approximately 22,000 students responded<br />
to this survey;<br />
» National teacher survey: to understand teachers’ perceptions<br />
of their working environment, teaching practices, teacher<br />
workload, support received, and issues faced. Around 15,000<br />
teachers responded to this survey; and<br />
» National principal survey: to understand principals’<br />
perceptions of skills required, training received, and time<br />
allocation. 570 principals responded to this survey.<br />
» Ministry focus groups and interviews: Officers from the<br />
Ministry at the Federal level were engaged to obtain a firsthand<br />
understanding of the critical elements of delivery. This process<br />
of gaining deep perspectives on the system was key to the<br />
development of the <strong>Blueprint</strong>. Focus groups were conducted<br />
across the Ministry, including with the following:<br />
» Research and Evaluation Sector, EPRD: student<br />
participation and performance in international assessments<br />
including PISA and TIMSS;<br />
» Public School Management Division: deployment of teachers<br />
to national schools, both at primary and secondary level;<br />
» Financial Assistance Unit, Finance Division: understanding<br />
the 22 financial assistance programmes available for schools<br />
and students, the allocation mechanism and challenges, and<br />
perspectives on effectiveness of financial aid handouts, especially<br />
to students;<br />
» Teacher Unit, Human Resource Division: understanding<br />
compensation schemes of teachers and average starting pay of<br />
graduate teachers; and<br />
» Maintenance Unit, Development Division: conditions<br />
of infrastructure in schools and challenges in conducting<br />
maintenance and repair works.<br />
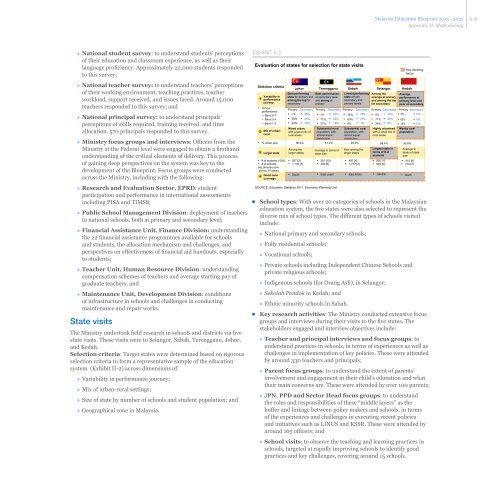
state visits<br />
The Ministry undertook field research in schools and districts via five<br />
state visits. These visits were to Selangor, Sabah, Terengganu, Johor,<br />
and Kedah.<br />
Selection criteria: Target states were determined based on rigorous<br />
selection criteria to form a representative sample of the education<br />
system (Exhibit II-2) across dimensions of:<br />
» Variability in performance journey;<br />
» Mix of urban-rural settings;<br />
» Size of state by number of schools and student population; and<br />
» Geographical zone in Malaysia.<br />
Exhibit ii-2<br />
Evaluation of states for selection for state visits<br />
Selection criteria<br />
Variability in<br />
1 performance<br />
journey<br />
▪ School<br />
performance<br />
– Band 5-7<br />
– Band 3-4<br />
– Band 1-2<br />
2<br />
▪ % urban pop.<br />
3<br />
▪ # of students (‘000)<br />
▪ # of schools<br />
[xx] denotes rank<br />
across 14 states<br />
4<br />
Mix of urbanrural<br />
Larger state<br />
Good zone<br />
coverage<br />
Johor Terengganu<br />
Best performing Best performance<br />
state for primary and at secondary level<br />
among the top for and strong at<br />
secondary<br />
primary<br />
Mixed urban,<br />
with a good mix of<br />
rural areas<br />
66.2%<br />
Among the<br />
larger states<br />
▪ 657 [2]<br />
▪ 1,130 [3]<br />
Substantial rural<br />
population, with<br />
almost equal<br />
distribution<br />
51.2%<br />
Average in terms of<br />
state size<br />
▪ 261 [10]<br />
▪ 484 [9]<br />
Sabah<br />
Lowest performing<br />
state at both<br />
secondary and<br />
primary levels<br />
Substantial rural<br />
population, with<br />
almost equal<br />
distribution<br />
49.3%<br />
Also among the<br />
larger states<br />
▪ 497 [4]<br />
▪ 1,277 [2]<br />
▪ South ▪ East coast ▪ East M’sia<br />
Malaysia Education <strong>Blueprint</strong> 2013 - 2025<br />
Appendix II. Methodology<br />
Selangor<br />
Among the<br />
average at primary<br />
and among the top<br />
for secondary<br />
Primary Secondary Primary Secondary Primary Secondary Primary Secondary<br />
▪ 1% ▪ 56% ▪ 1% ▪ 61% ▪ 36% ▪ 78% ▪ 5% ▪ 47%<br />
▪ 58% ▪ 34% ▪ 71% ▪ 24% ▪ 60% ▪ 21% ▪ 71% ▪ 44% ▪ 82%<br />
▪ 40% ▪ 10% ▪ 27% ▪ 14% ▪ 4% ▪ 1% ▪ 24% ▪ 9% ▪ 15%<br />
SOURCE: Education Statistics 2011; Economic Planning Unit<br />
Highly urbanised,<br />
with a small mix of<br />
rural areas<br />
88.4%<br />
Largest state in<br />
terms of # of<br />
students<br />
▪ 930 [1]<br />
▪ 903 [5]<br />
▪ Central<br />
Key deciding<br />
factor<br />
Kedah<br />
Average<br />
performance at<br />
primary level and<br />
poor at secondary<br />
Primary Secondary<br />
▪ 3% ▪ 74%<br />
Mostly rural<br />
population<br />
40.8%<br />
Average in<br />
terms of state<br />
size<br />
▪ 415 [6]<br />
▪ 712 [7]<br />
▪ North<br />
▪ 16%<br />
▪ 10%<br />
▪ School types: With over 20 categories of schools in the Malaysian<br />
education system, the five states were also selected to represent the<br />
diverse mix of school types. The different types of schools visited<br />
include:<br />
» National primary and secondary schools;<br />
» Fully residential schools;<br />
» Vocational schools;<br />
» Private schools including Independent Chinese Schools and<br />
private religious schools;<br />
» Indigenous schools (for Orang Asli), in Selangor;<br />
» Sekolah Pondok in Kedah; and<br />
» Ethnic minority schools in Sabah.<br />
▪ Key research activities: The Ministry conducted extensive focus<br />
groups and interviews during their visits to the five states. The<br />
stakeholders engaged and interview objectives include:<br />
» Teacher and principal interviews and focus groups: to<br />
understand practices in schools, in terms of experiences as well as<br />
challenges in implementation of key policies. These were attended<br />
by around 330 teachers and principals;<br />
» Parent focus groups: to understand the extent of parents’<br />
involvement and engagement in their child’s education and what<br />
their main concerns are. These were attended by over 100 parents;<br />
» JPN, PPD and Sector Head focus groups: to understand<br />
the roles and responsibilities of these “middle layers” as the<br />
buffer and linkage between policy makers and schools, in terms<br />
of the experiences and challenges in executing recent policies<br />
and initiatives such as LINUS and KSSR. These were attended by<br />
around 165 officers; and<br />
» School visits: to observe the teaching and learning practices in<br />
schools, targeted at rapidly improving schools to identify good<br />
practices and key challenges, covering around 15 schools.<br />
A-8