estudio de posibilidades y viabilidad de actividades ... - Coag
estudio de posibilidades y viabilidad de actividades ... - Coag
estudio de posibilidades y viabilidad de actividades ... - Coag

Create successful ePaper yourself
Turn your PDF publications into a flip-book with our unique Google optimized e-Paper software.
9.<br />
CASTILLA Y LEÓN<br />
Estudio <strong>de</strong> posibilida<strong>de</strong>s y <strong>viabilidad</strong><br />
<strong>de</strong> activida<strong>de</strong>s agropecuarias alternativas en los<br />
municipios <strong>de</strong> Villabuena <strong>de</strong>l Puente (Zamora),<br />
Fuentepinilla (Soria) y Abia <strong>de</strong> las Torres (Palencia)<br />
TABLA 2. (FUENTE: MARM) TABLA 3.<br />
DENOMINACIONES DE ORIGEN (D.O.P.) E<br />
INDICACIONES GEOGRÁFICAS (I.G.P.) DE<br />
PRODUCTOS AGROALIMENTARIOS cuya<br />
zona <strong>de</strong> producción se extien<strong>de</strong> a sólo a<br />
Castilla y León<br />
DOP MANTEQUILLA DE SORIA<br />
DOP MANZANA REINETA DEL BIERZO<br />
DOP QUESO ZAMORANO<br />
IGP ALUBIA DE LA BAÑEZA-LEÓN<br />
IGP BOTILLO DEL BIERZO<br />
IGP CARNE DE MORUCHA DE SALAMANCA<br />
IGP CECINA DE LEÓN<br />
IGP CHORIZO DE CANTIMPALOS<br />
IGP GARBANZO DE FUENTESAÚCO<br />
IGP JUDÍAS DE EL BARCO DE ÁVILA<br />
IGP LECHAZO DE CASTILLA Y LEÓN<br />
IGP LENTEJA DE LA ARMUÑA<br />
IGP LENTEJA PARDINA DE TIERRA DE CAMPOS<br />
IGP MANTECADAS DE ASTORGA<br />
IGP PIMIENTO ASADO DEL BIERZO<br />
IGP PIMIENTO FRESNO-BENAVENTE<br />
IGP QUESO DE VALDEÓN<br />
Año<br />
Sup. Calificada<br />
en 1er año <strong>de</strong> prácticas<br />
Sup. Calificada en Conversión Sup. Calificada en AE. Sup. Total inscrita en AE<br />
2001 14.796,89 256,13 931,19 15.984,21<br />
2002 9.667,15 1.018,33 1.830,61 12.516,09<br />
2003 9.503,89 666,18 3.331,93 13.502<br />
2004 1.417,7 1.921,24 11.131,15 14.470,09<br />
2005 1.478,59 1.468,49 9.205,64 12.152,72<br />
2006 1.941,76 958,38 9.739,3 12.639,44<br />
2007 5.426,32 1.747,89 10.668,35 17.842,56<br />
2008 6.086,88 1.058,79 11.766,98 18.912,65<br />
2009 5.806,88 3.928,38 12.419 22.154,25<br />
2010 6.630,06 3.989,99 1.535,62 26.355,67<br />
Fuente: MARM<br />
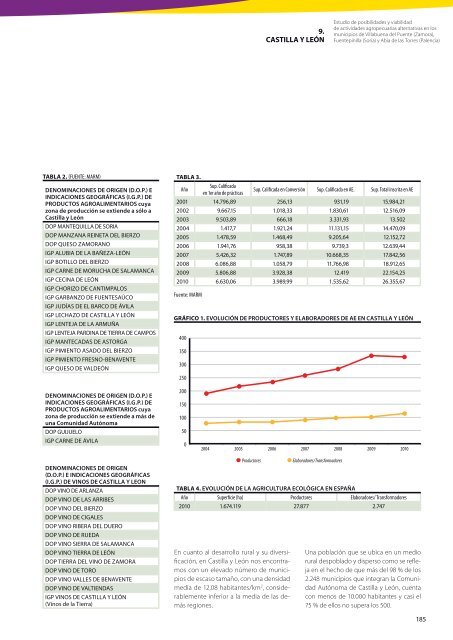
GRÁFICO 1. EVOLUCIÓN DE PRODUCTORES Y ELABORADORES DE AE EN CASTILLA Y LEÓN<br />
400<br />
350<br />
300<br />
250<br />
DENOMINACIONES DE ORIGEN (D.O.P.) E<br />
INDICACIONES GEOGRÁFICAS (I.G.P.) DE<br />
PRODUCTOS AGROALIMENTARIOS cuya<br />
zona <strong>de</strong> producción se extien<strong>de</strong> a más <strong>de</strong><br />
una Comunidad Autónoma<br />
DOP GUIJUELO<br />
IGP CARNE DE ÁVILA<br />
200<br />
150<br />
100<br />
50<br />
0<br />
2004 2005 2006 2007 2008 2009<br />
2010<br />
DENOMINACIONES DE ORIGEN<br />
(D.O.P.) E INDICACIONES GEOGRÁFICAS<br />
(I.G.P.) DE VINOS DE CASTILLA Y LEON<br />
DOP VINO DE ARLANZA<br />
DOP VINO DE LAS ARRIBES<br />
DOP VINO DEL BIERZO<br />
DOP VINO DE CIGALES<br />
DOP VINO RIBERA DEL DUERO<br />
DOP VINO DE RUEDA<br />
DOP VINO SIERRA DE SALAMANCA<br />
DOP VINO TIERRA DE LEÓN<br />
DOP TIERRA DEL VINO DE ZAMORA<br />
DOP VINO DE TORO<br />
DOP VINO VALLES DE BENAVENTE<br />
DOP VINO DE VALTIENDAS<br />
IGP VINOS DE CASTILLA Y LEÓN<br />
(Vinos <strong>de</strong> la Tierra)<br />
Productores<br />
TABLA 4. EVOLUCIÓN DE LA AGRICULTURA ECOLÓGICA EN ESPAÑA<br />
Año Superficie (ha) Productores Elaboradores/ Transformadores<br />
2010 1.674.119 27.877 2.747<br />
En cuanto al <strong>de</strong>sarrollo rural y su diversificación,<br />
en Castilla y León nos encontramos<br />
con un elevado número <strong>de</strong> municipios<br />
<strong>de</strong> escaso tamaño, con una <strong>de</strong>nsidad<br />
media <strong>de</strong> 12,08 habitantes/km 2 , consi<strong>de</strong>rablemente<br />
inferior a la media <strong>de</strong> las <strong>de</strong>más<br />
regiones.<br />
Elaboradores/Transformadores<br />
Una población que se ubica en un medio<br />
rural <strong>de</strong>spoblado y disperso como se refleja<br />
en el hecho <strong>de</strong> que más <strong>de</strong>l 98 % <strong>de</strong> los<br />
2.248 municipios que integran la Comunidad<br />
Autónoma <strong>de</strong> Castilla y León, cuenta<br />
con menos <strong>de</strong> 10.000 habitantes y casi el<br />
75 % <strong>de</strong> ellos no supera los 500.<br />
185