estudio de posibilidades y viabilidad de actividades ... - Coag
estudio de posibilidades y viabilidad de actividades ... - Coag
estudio de posibilidades y viabilidad de actividades ... - Coag

You also want an ePaper? Increase the reach of your titles
YUMPU automatically turns print PDFs into web optimized ePapers that Google loves.
9.<br />
CASTILLA Y LEÓN<br />
Estudio <strong>de</strong> posibilida<strong>de</strong>s y <strong>viabilidad</strong><br />
<strong>de</strong> activida<strong>de</strong>s agropecuarias alternativas en los<br />
municipios <strong>de</strong> Villabuena <strong>de</strong>l Puente (Zamora),<br />
Fuentepinilla (Soria) y Abia <strong>de</strong> las Torres (Palencia)<br />
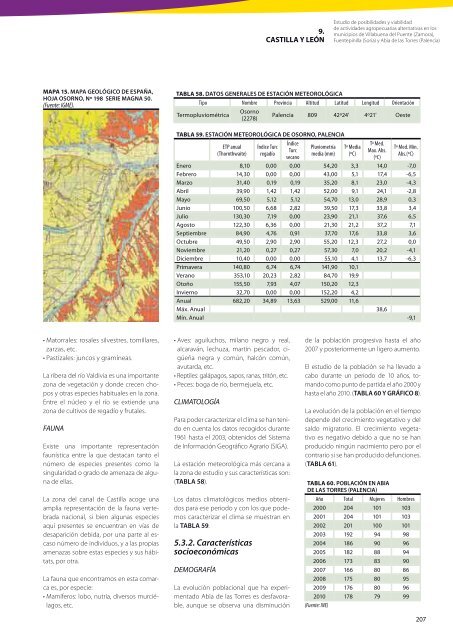
MAPA 15. MAPA GEOLÓGICO DE ESPAÑA,<br />
HOJA OSORNO, Nº 198 SERIE MAGNA 50.<br />
(Fuente: IGME).<br />
TABLA 58. DATOS GENERALES DE ESTACIÓN METEOROLÓGICA<br />
Tipo Nombre Provincia Altitud Latitud Longitud Orientación<br />
Termopluviométrica<br />
Osorno<br />
(2278)<br />
Palencia 809 42º24' 4º21' Oeste<br />
TABLA 59. ESTACIÓN METEOROLÓGICA DE OSORNO, PALENCIA<br />
ETP anual<br />
(Thornthwaite)<br />
Índice Turc<br />
regadío<br />
Índice<br />
Turc<br />
secano<br />
Pluviometría<br />
media (mm)<br />
Tª Media<br />
(ºC)<br />
Tª Med.<br />
Max. Abs.<br />
(ºC)<br />
Tª Med. Min.<br />
Abs.(ºC)<br />
Enero 8,10 0,00 0,00 54,20 3,3 14,0 -7,0<br />
Febrero 14,30 0,00 0,00 43,00 5,1 17,4 -6,5<br />
Marzo 31,40 0,19 0,19 35,20 8,1 23,0 -4,3<br />
Abril 39,90 1,42 1,42 52,00 9,1 24,1 -2,8<br />
Mayo 69,50 5,12 5,12 54,70 13,0 28,9 0,3<br />
Junio 100,50 6,68 2,82 39,50 17,3 33,8 3,4<br />
Julio 130,30 7,19 0,00 23,90 21,1 37,6 6,5<br />
Agosto 122,30 6,36 0,00 21,30 21,2 37,2 7,1<br />
Septiembre 84,90 4,76 0,91 37,70 17,6 33,8 3,6<br />
Octubre 49,50 2,90 2,90 55,20 12,3 27,2 0,0<br />
Noviembre 21,20 0,27 0,27 57,30 7,0 20,2 -4,1<br />
Diciembre 10,40 0,00 0,00 55,10 4,1 13,7 -6,3<br />
Primavera 140,80 6,74 6,74 141,90 10,1<br />
Verano 353,10 20,23 2,82 84,70 19,9<br />
Otoño 155,50 7,93 4,07 150,20 12,3<br />
Invierno 32,70 0,00 0,00 152,20 4,2<br />
Anual 682,20 34,89 13,63 529,00 11,6<br />
Máx. Anual 38,6<br />
Mín. Anual -9,1<br />
Matorrales: rosales silvestres, tomillares,<br />
zarzas, etc.<br />
Pastizales: juncos y gramíneas.<br />
La ribera <strong>de</strong>l río Valdivia es una importante<br />
zona <strong>de</strong> vegetación y don<strong>de</strong> crecen chopos<br />
y otras especies habituales en la zona.<br />
Entre el núcleo y el río se extien<strong>de</strong> una<br />
zona <strong>de</strong> cultivos <strong>de</strong> regadío y frutales.<br />
FAUNA<br />
Existe una importante representación<br />
faunística entre la que <strong>de</strong>stacan tanto el<br />
número <strong>de</strong> especies presentes como la<br />
singularidad o grado <strong>de</strong> amenaza <strong>de</strong> alguna<br />
<strong>de</strong> ellas.<br />
La zona <strong>de</strong>l canal <strong>de</strong> Castilla acoge una<br />
amplia representación <strong>de</strong> la fauna vertebrada<br />
nacional, si bien algunas especies<br />
aquí presentes se encuentran en vías <strong>de</strong><br />
<strong>de</strong>saparición <strong>de</strong>bida, por una parte al escaso<br />
número <strong>de</strong> individuos, y a las propias<br />
amenazas sobre estas especies y sus hábitats,<br />
por otra.<br />
La fauna que encontramos en esta comarca<br />
es, por especie:<br />
lagos,<br />
etc.<br />
<br />
alcaraván, lechuza, martín pescador, cigüeña<br />
negra y común, halcón común,<br />
avutarda, etc.<br />
<br />
<br />
CLIMATOLOGÍA<br />
Para po<strong>de</strong>r caracterizar el clima se han tenido<br />
en cuenta los datos recogidos durante<br />
1961 hasta el 2003, obtenidos <strong>de</strong>l Sistema<br />
<strong>de</strong> Información Geográfico Agrario (SIGA).<br />
La estación meteorológica más cercana a<br />
la zona <strong>de</strong> <strong>estudio</strong> y sus características son:<br />
(TABLA 58).<br />
Los datos climatológicos medios obtenidos<br />
para ese periodo y con los que po<strong>de</strong>mos<br />
caracterizar el clima se muestran en<br />
la TABLA 59.<br />
5.3.2. Características<br />
socioeconómicas<br />
DEMOGRAFÍA<br />
La evolución poblacional que ha experimentado<br />
Abia <strong>de</strong> las Torres es <strong>de</strong>sfavorable,<br />
aunque se observa una disminución<br />
<strong>de</strong> la población progresiva hasta el año<br />
2007 y posteriormente un ligero aumento.<br />
El <strong>estudio</strong> <strong>de</strong> la población se ha llevado a<br />
cabo durante un periodo <strong>de</strong> 10 años, tomando<br />
como punto <strong>de</strong> partida el año 2000 y<br />
hasta el año 2010. (TABLA 60 Y GRÁFICO 8).<br />
La evolución <strong>de</strong> la población en el tiempo<br />
<strong>de</strong>pen<strong>de</strong> <strong>de</strong>l crecimiento vegetativo y <strong>de</strong>l<br />
saldo migratorio. El crecimiento vegetativo<br />
es negativo <strong>de</strong>bido a que no se han<br />
producido ningún nacimiento pero por el<br />
contrario si se han producido <strong>de</strong>funciones.<br />
(TABLA 61).<br />
TABLA 60. POBLACIÓN EN ABIA<br />
DE LAS TORRES (PALENCIA)<br />
Año Total Mujeres Hombres<br />
2000 204 101 103<br />
2001 204 101 103<br />
2002 201 100 101<br />
2003 192 94 98<br />
2004 186 90 96<br />
2005 182 88 94<br />
2006 173 83 90<br />
2007 166 80 86<br />
2008 175 80 95<br />
2009 176 80 96<br />
2010 178 79 99<br />
(Fuente: INE)<br />
207