Ecole Nationale Supérieure Agronomique de Montpellier ... - CIAM
Ecole Nationale Supérieure Agronomique de Montpellier ... - CIAM
Ecole Nationale Supérieure Agronomique de Montpellier ... - CIAM

Create successful ePaper yourself
Turn your PDF publications into a flip-book with our unique Google optimized e-Paper software.
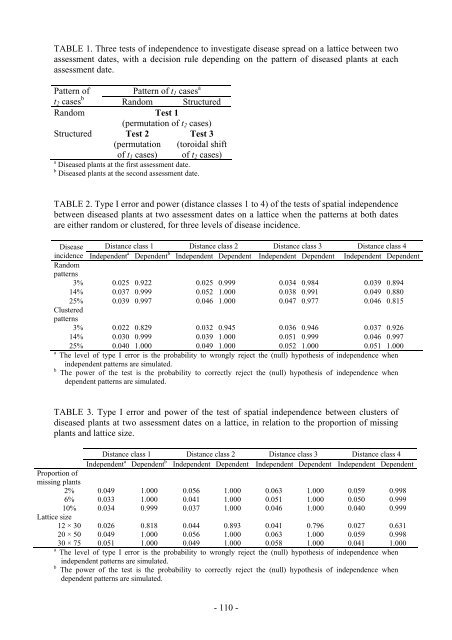
TABLE 1. Three tests of in<strong>de</strong>pen<strong>de</strong>nce to investigate disease spread on a lattice between two<br />
assessment dates, with a <strong>de</strong>cision rule <strong>de</strong>pending on the pattern of diseased plants at each<br />
assessment date.<br />
Pattern of t1 cases a<br />
Pattern of<br />
t2 cases b Random Structured<br />
Random Test 1<br />
Structured Test 2<br />
(permutation<br />
(permutation of t2 cases)<br />
of t1 cases)<br />
a Diseased plants at the first assessment date.<br />
b Diseased plants at the second assessment date.<br />
Test 3<br />
(toroidal shift<br />
of t2 cases)<br />
TABLE 2. Type I error and power (distance classes 1 to 4) of the tests of spatial in<strong>de</strong>pen<strong>de</strong>nce<br />
between diseased plants at two assessment dates on a lattice when the patterns at both dates<br />
are either random or clustered, for three levels of disease inci<strong>de</strong>nce.<br />
Disease Distance class 1 Distance class 2 Distance class 3 Distance class 4<br />
inci<strong>de</strong>nce In<strong>de</strong>pen<strong>de</strong>nt a Depen<strong>de</strong>nt b In<strong>de</strong>pen<strong>de</strong>nt Depen<strong>de</strong>nt<br />
Random<br />
patterns<br />
In<strong>de</strong>pen<strong>de</strong>nt Depen<strong>de</strong>nt In<strong>de</strong>pen<strong>de</strong>nt Depen<strong>de</strong>nt<br />
3% 0.025 0.922 0.025 0.999 0.034 0.984 0.039 0.894<br />
14% 0.037 0.999 0.052 1.000 0.038 0.991 0.049 0.880<br />
25%<br />
Clustered<br />
patterns<br />
0.039 0.997 0.046 1.000 0.047 0.977 0.046 0.815<br />
3% 0.022 0.829 0.032 0.945 0.036 0.946 0.037 0.926<br />
14% 0.030 0.999 0.039 1.000 0.051 0.999 0.046 0.997<br />
25% 0.040 1.000 0.049 1.000 0.052 1.000 0.051 1.000<br />
a<br />
The level of type I error is the probability to wrongly reject the (null) hypothesis of in<strong>de</strong>pen<strong>de</strong>nce when<br />
in<strong>de</strong>pen<strong>de</strong>nt patterns are simulated.<br />
b<br />
The power of the test is the probability to correctly reject the (null) hypothesis of in<strong>de</strong>pen<strong>de</strong>nce when<br />
<strong>de</strong>pen<strong>de</strong>nt patterns are simulated.<br />
TABLE 3. Type I error and power of the test of spatial in<strong>de</strong>pen<strong>de</strong>nce between clusters of<br />
diseased plants at two assessment dates on a lattice, in relation to the proportion of missing<br />
plants and lattice size.<br />
Distance class 1 Distance class 2 Distance class 3 Distance class 4<br />
In<strong>de</strong>pen<strong>de</strong>nt a Depen<strong>de</strong>nt b In<strong>de</strong>pen<strong>de</strong>nt Depen<strong>de</strong>nt In<strong>de</strong>pen<strong>de</strong>nt Depen<strong>de</strong>nt In<strong>de</strong>pen<strong>de</strong>nt Depen<strong>de</strong>nt<br />
Proportion of<br />
missing plants<br />
2% 0.049 1.000 0.056 1.000 0.063 1.000 0.059 0.998<br />
6% 0.033 1.000 0.041 1.000 0.051 1.000 0.050 0.999<br />
10% 0.034 0.999 0.037 1.000 0.046 1.000 0.040 0.999<br />
Lattice size<br />
12 × 30 0.026 0.818 0.044 0.893 0.041 0.796 0.027 0.631<br />
20 × 50 0.049 1.000 0.056 1.000 0.063 1.000 0.059 0.998<br />
30 × 75 0.051 1.000 0.049 1.000 0.058 1.000 0.041 1.000<br />
a The level of type I error is the probability to wrongly reject the (null) hypothesis of in<strong>de</strong>pen<strong>de</strong>nce when<br />
in<strong>de</strong>pen<strong>de</strong>nt patterns are simulated.<br />
b The power of the test is the probability to correctly reject the (null) hypothesis of in<strong>de</strong>pen<strong>de</strong>nce when<br />
<strong>de</strong>pen<strong>de</strong>nt patterns are simulated.<br />
- 110 -