Ecole Nationale Supérieure Agronomique de Montpellier ... - CIAM
Ecole Nationale Supérieure Agronomique de Montpellier ... - CIAM
Ecole Nationale Supérieure Agronomique de Montpellier ... - CIAM

You also want an ePaper? Increase the reach of your titles
YUMPU automatically turns print PDFs into web optimized ePapers that Google loves.
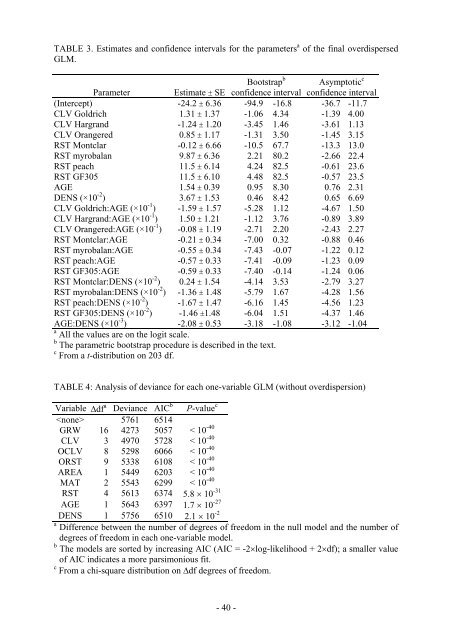
TABLE 3. Estimates and confi<strong>de</strong>nce intervals for the parameters a of the final overdispersed<br />
GLM.<br />
Parameter Estimate ± SE<br />
- 40 -<br />
Bootstrap b<br />
confi<strong>de</strong>nce interval<br />
Asymptotic c<br />
confi<strong>de</strong>nce interval<br />
(Intercept) -24.2 ± 6.36 -94.9 -16.8 -36.7 -11.7<br />
CLV Goldrich 1.31 ± 1.37 -1.06 4.34 -1.39 4.00<br />
CLV Hargrand -1.24 ± 1.20 -3.45 1.46 -3.61 1.13<br />
CLV Orangered 0.85 ± 1.17 -1.31 3.50 -1.45 3.15<br />
RST Montclar -0.12 ± 6.66 -10.5 67.7 -13.3 13.0<br />
RST myrobalan 9.87 ± 6.36 2.21 80.2 -2.66 22.4<br />
RST peach 11.5 ± 6.14 4.24 82.5 -0.61 23.6<br />
RST GF305 11.5 ± 6.10 4.48 82.5 -0.57 23.5<br />
AGE 1.54 ± 0.39 0.95 8.30 0.76 2.31<br />
DENS (×10 -2 ) 3.67 ± 1.53 0.46 8.42 0.65 6.69<br />
CLV Goldrich:AGE (×10 -1 ) -1.59 ± 1.57 -5.28 1.12 -4.67 1.50<br />
CLV Hargrand:AGE (×10 -1 ) 1.50 ± 1.21 -1.12 3.76 -0.89 3.89<br />
CLV Orangered:AGE (×10 -1 ) -0.08 ± 1.19 -2.71 2.20 -2.43 2.27<br />
RST Montclar:AGE -0.21 ± 0.34 -7.00 0.32 -0.88 0.46<br />
RST myrobalan:AGE -0.55 ± 0.34 -7.43 -0.07 -1.22 0.12<br />
RST peach:AGE -0.57 ± 0.33 -7.41 -0.09 -1.23 0.09<br />
RST GF305:AGE -0.59 ± 0.33 -7.40 -0.14 -1.24 0.06<br />
RST Montclar:DENS (×10 -2 ) 0.24 ± 1.54 -4.14 3.53 -2.79 3.27<br />
RST myrobalan:DENS (×10 -2 ) -1.36 ± 1.48 -5.79 1.67 -4.28 1.56<br />
RST peach:DENS (×10 -2 ) -1.67 ± 1.47 -6.16 1.45 -4.56 1.23<br />
RST GF305:DENS (×10 -2 ) -1.46 ±1.48 -6.04 1.51 -4.37 1.46<br />
AGE:DENS (×10 -3 ) -2.08 ± 0.53 -3.18 -1.08 -3.12 -1.04<br />
a All the values are on the logit scale.<br />
b The parametric bootstrap procedure is <strong>de</strong>scribed in the text.<br />
c From a t-distribution on 203 df.<br />
TABLE 4: Analysis of <strong>de</strong>viance for each one-variable GLM (without overdispersion)<br />
Variable Δdf a Deviance AIC b P-value c<br />
5761 6514<br />
GRW 16 4273 5057 < 10 -40<br />
CLV 3 4970 5728 < 10 -40<br />
OCLV 8 5298 6066 < 10 -40<br />
ORST 9 5338 6108 < 10 -40<br />
AREA 1 5449 6203 < 10 -40<br />
MAT 2 5543 6299 < 10 -40<br />
RST 4 5613 6374 5.8 × 10 -31<br />
AGE 1 5643 6397 1.7 × 10 -27<br />
DENS 1 5756 6510 2.1 × 10 -2<br />
a Difference between the number of <strong>de</strong>grees of freedom in the null mo<strong>de</strong>l and the number of<br />
<strong>de</strong>grees of freedom in each one-variable mo<strong>de</strong>l.<br />
b The mo<strong>de</strong>ls are sorted by increasing AIC (AIC = -2×log-likelihood + 2×df); a smaller value<br />
of AIC indicates a more parsimonious fit.<br />
c From a chi-square distribution on Δdf <strong>de</strong>grees of freedom.