Ecole Nationale Supérieure Agronomique de Montpellier ... - CIAM
Ecole Nationale Supérieure Agronomique de Montpellier ... - CIAM
Ecole Nationale Supérieure Agronomique de Montpellier ... - CIAM

You also want an ePaper? Increase the reach of your titles
YUMPU automatically turns print PDFs into web optimized ePapers that Google loves.
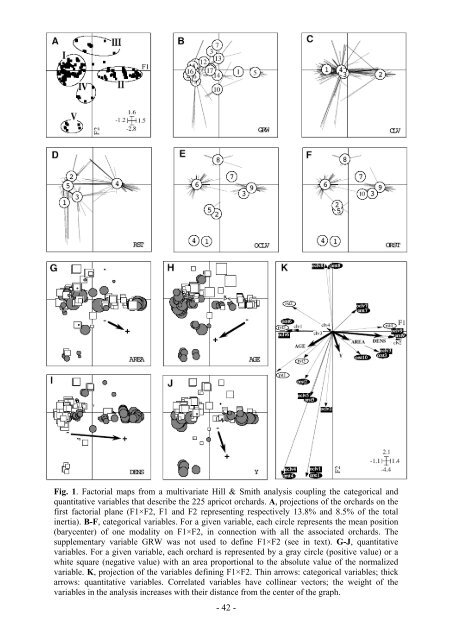
Fig. 1. Factorial maps from a multivariate Hill & Smith analysis coupling the categorical and<br />
quantitative variables that <strong>de</strong>scribe the 225 apricot orchards. A, projections of the orchards on the<br />
first factorial plane (F1×F2, F1 and F2 representing respectively 13.8% and 8.5% of the total<br />
inertia). B-F, categorical variables. For a given variable, each circle represents the mean position<br />
(barycenter) of one modality on F1×F2, in connection with all the associated orchards. The<br />
supplementary variable GRW was not used to <strong>de</strong>fine F1×F2 (see in text). G-J, quantitative<br />
variables. For a given variable, each orchard is represented by a gray circle (positive value) or a<br />
white square (negative value) with an area proportional to the absolute value of the normalized<br />
variable. K, projection of the variables <strong>de</strong>fining F1×F2. Thin arrows: categorical variables; thick<br />
arrows: quantitative variables. Correlated variables have collinear vectors; the weight of the<br />
variables in the analysis increases with their distance from the center of the graph.<br />
- 42 -