- Page 1 and 2:
Airline Air Wisconsin Alaska Allegh
- Page 3 and 4:
AVIATION RULEMAKING ADVISORY COI\Í
- Page 5 and 6:
-..-.-__-^ Another reference is A S
- Page 7 and 8:
121 .xxx Reserve Rest (a) (b) (c) P
- Page 9 and 10:
12l.xxx Reseme Rest Part II: Pilots
- Page 11 and 12:
(2) Rescheduling the beginning of a
- Page 13 and 14:
(c) A certiftcate holder may assign
- Page 15 and 16:
(d) When there are no other resene
- Page 17 and 18:
A Example: Example: For augmented I
- Page 19 and 20:
. . . It is important to realize th
- Page 21 and 22:
(3) Rescheduling the Protected rime
- Page 23 and 24:
with time since awake for all times
- Page 25 and 26:
alerting is gone, when you're alone
- Page 27 and 28:
circadian lo*'¡here is a very shar
- Page 29 and 30:
(d) When there are no other reseme
- Page 31 and 32:
a A a A a A We're shooting around t
- Page 33 and 34:
V X I q N g d d V
- Page 35 and 36:
Table of Contents l.O Crcnerat Prin
- Page 37 and 38:
INTRODUCTION PrinciPles and Guideli
- Page 39 and 40:
has obtaincd required sle+ will be
- Page 41 and 42:
speciñc principles and guidetines
- Page 43 and 44:
perfomrance-impairing fatigue. Ther
- Page 45 and 46:
2.7 summary overview: Guidelines an
- Page 47 and 48:
REPORT DOCU]VI ËNì AI'ION PAUts,
- Page 49 and 50:
Uterature Reyiex' An Overvlew of th
- Page 51 and 52:
\l'hat Is Fatigue The oblectir.e of
- Page 53 and 54:
cf inaction t1'pical of fatigue (Nc
- Page 55 and 56:
The orderty planning and sequencing
- Page 57 and 58:
mrcrosleeps can also lead to enor o
- Page 59 and 60:
\ hen in fact they *'ere in thc pro
- Page 61 and 62:
shift *orkers (Colligan & Tepas. 19
- Page 63 and 64:
Environmental Factors The ph¡sical
- Page 65 and 66:
exrended or reduced ,{,lthough resu
- Page 67 and 68:
concluded (hat at least ló hou¡so
- Page 69 and 70:
thar re:tncrrng sleep to 5 hor.¡¡
- Page 71 and 72:
e\rernal en\rronrrcnt around the24
- Page 73 and 74:
L¡,m- and orlad¡ ( 198 I ). in th
- Page 75 and 76:
addit¡on murriplc missions and cum
- Page 77 and 78:
Augmented Cren's Linle rescarch has
- Page 79 and 80:
urnc asle€p and auditory th¡esho
- Page 81 and 82:
Denrcnt. \\'. c.. c¿¡skadon. M. 4
- Page 83 and 84:
Hamson. Y.. Horne.J. A' (1997)' Sle
- Page 85 and 86:
Lun¡.T D..French J.&Mircha.J.L (19
- Page 87 and 88:
(Eds.). Ìtiight and Shift \\'ork.
- Page 89 and 90:
p,oceedings o_f a sepr,-ntber r99J
- Page 91 and 92:
O X-éZlrj¡ú'uÞ
- Page 93 and 94:
"Review of propccd flþht d-ury E4l
- Page 95 and 96:
'i!îiîri'Jüffi ,['å3åo,ilfi ff
- Page 97 and 98:
"Review of proposcd flight d-uty rc
- Page 99 and 100:
"Review of proposcd flight dury rcg
- Page 101 and 102:
"Rerriew of pmposcd flight duty æg
- Page 103 and 104:
"Rcview of proposcd flight d-ury re
- Page 105 and 106:
"Review of proposcd flight d-ury rc
- Page 107 and 108:
"Revicw of propæcd flight dury rcg
- Page 109 and 110:
Remarks by Dr. William Dement to th
- Page 111 and 112:
The second thing is that all sleep
- Page 113 and 114:
Well, there's an ideal time to slee
- Page 115 and 116:
I'm typicallv so sleep depriaed tha
- Page 117 and 118:
Coing beyond that, what is probably
- Page 119 and 120:
could certainly get the probability
- Page 121 and 122:
that WOCL, if you will. Whether it'
- Page 123 and 124:
It seems lilce common sense. Fairly
- Page 125 and 126:
All sorts of things happen, but the
- Page 127 and 128:
Fatigue, Alcohol and Perforrnance I
- Page 129:
taj X-VZFJ¡ÉFúÞ
- Page 132 and 133:
TNTRODUCTION The rcgative ::-pa:i o
- Page 134 and 135:
}IETHOD Subjccts Tweuty-two partici
- Page 136 and 137:
Druing test sessions, subjects were
- Page 138 and 139:
(t:00em¡:esing sesslcn of each con
- Page 140 and 141:
P€rformance pruErneter \Àas asso
- Page 142 and 143:
irnpaircd by apprcx:raarely 6 87ó
- Page 144 and 145:
-+-.r more complex neurobcbsvior¡r
- Page 146 and 147:
A rurth:r expla:ration for thc dtff
- Page 148 and 149:
REFERE]{CES Angus, R.G. and Heslegn
- Page 150 and 151:
Mullaney, D.J., Kripkc, D.F., Flec&
- Page 152 and 153:
TABLE I Summary of li¡ea¡ rgessio
- Page 154 and 155:
e ;U tr E.2 I 6 o 8.6 ¡u l z-¿ -1
- Page 156 and 157:
t) 2 a E e ê. 1) G C () 'l I 1 -¡
- Page 158 and 159:
I I äãË 's.8 ¡ Zã¿ .- , ¡r
- Page 160 and 161:
Crev. tattgue tactors m a\nauon ac
- Page 162:
Cre'., fattgue tactors tn auarlon a
- Page 165 and 166:
AIR CARRIER OPERATIONS ISSUES GROUP
- Page 167 and 168:
L AIR LINE PILOTS 535 HEFìNDON PAF
- Page 169 and 170:
Economic Impact Industr.v/managemen
- Page 171 and 172:
Daæ: Februarl' l, 1999 To: Air Ca
- Page 173 and 174:
ARAC WORKING GROUP PILOT MEMBERS SU
- Page 175 and 176:
Airline Air Wisconsin Alaska Allegh
- Page 177 and 178:
AVIATION RULEMAKING ADVISORY CONÍM
- Page 179 and 180:
Another reference is A Sci¿n¡ific
- Page 181 and 182:
l2l.xxx Reserve Rest PART I: PROPOS
- Page 183 and 184:
Part II: Pilots' Proposal with Inte
- Page 185 and 186:
(2) Rescheduling the beginning of a
- Page 187 and 188:
(c) A certiftcate holder may assign
- Page 189 and 190:
(d) When therc ore no olher resene
- Page 191 and 192:
A Example: Example: For augmented I
- Page 193 and 194:
. . . It is importanr to realize th
- Page 195 and 196:
t (3) Rescheduling the Protected Ti
- Page 197 and 198:
with tirne since awake for all time
- Page 199 and 200:
alerting is gone. when you're alone
- Page 201 and 202:
circadian low there is a very sharp
- Page 203 and 204:
t (d) When lhere are no other reser
- Page 205 and 206:
Q: We're shooting a¡ound the subje
- Page 208 and 209:
a o a
- Page 210 and 211:
Teblc of Contents 1.0 -'i.iéi;;,t;
- Page 212 and 213:
- Ch¡.lleugç to Human Pbysiologr
- Page 214 and 215:
¡s ob¡ai¡rcd required sle+ *ill
- Page 216 and 217:
spcciñc prirriptes and guidclincs
- Page 218 and 219:
pcrformancc-impairing fatig.ß Tlpr
- Page 220 and 221:
2.? Summary Overview: Guidelines ¡
- Page 222:
REPORT DOCUMENTATION PAGE Fotn 49a6
- Page 225 and 226:
I)teralure R¿r ¡e x An Ovcrvtew o
- Page 227 and 228:
\t'h¡t ls Fatigue The ob¡ccti'e o
- Page 229 and 230:
Sccrcury Ron Brown funher illustrar
- Page 231 and 232:
The orderly planning and sequencing
- Page 233 and 234:
mlcrosleeps can also lead to enor o
- Page 235 and 236:
\Ahcn in fact thcy r¡'erc in t5c p
- Page 237 and 238:
shift uorken (Colligan & Tepas. l9t
- Page 239 and 240:
Environmentel Factots The phrsic¡l
- Page 241 and 242:
ex¡cnded or reduced. Although resu
- Page 243 and 244:
conclu,Jed rhar at lcast l6 hor¡n
- Page 245 and 246:
that re:tnctrng slecp to 5 hou¡s p
- Page 247 and 248:
errernsl en\rronrEnt afound rhe 24
- Page 249 and 250:
L¡m- e¡¡,J orlad) ( lggl). in rh
- Page 251 and 252:
addiúon multiplc missions and cumu
- Page 253 and 254:
.\ugrnented Crews Linlc resca¡ch h
- Page 255 and 256:
unÉ aslecP and auditor)'th¡eshold
- Page 257 and 258:
Derrrnr. \\' C.. C¿¡skadon. M A"
- Page 259 and 260:
H¡¡rison. Y. Horne.J. A. t1997).
- Page 261 and 262: Lun¡.T D..French.J.&Mi¡cha.J L rl
- Page 263 and 264: Eds ). Night and Shrft tt'ork' P-.\
- Page 265 and 266: p,oceedtngs o-f o Septrntber l99J l
- Page 268 and 269: A SCMTSTTHC Rg\ÆW OF PNOPOSSP RTCU
- Page 270 and 271: "Review of proposcd ftiSht d-ury tr
- Page 272 and 273: "Rernew of proposcd flight dury rcg
- Page 274 and 275: ff îíä?'effi ,trslågr'f#J"iTö'
- Page 276 and 277: '*îïä?'Jüffi ,['å3å'üitr#.i"
- Page 278 and 279: "Review of proposcd flighr dury reg
- Page 280 and 281: 'l,cview of propæcd ftight d-ury r
- Page 282 and 283: "Rcview of proposcd flight duty rcg
- Page 285 and 286: Remarks by Dr. William Dement to th
- Page 287 and 288: Well, there's an ideal time to slee
- Page 289 and 290: I wanted to say three or four thing
- Page 291 and 292: So those are the three main things.
- Page 293 and 294: -fact thnt t hours nny be adequate
- Page 295 and 296: you tolerate before you have a micr
- Page 297 and 298: do some studies and vou can demonst
- Page 299: First of all, why does he have to r
- Page 302: cognitive psychomotor perforrnance
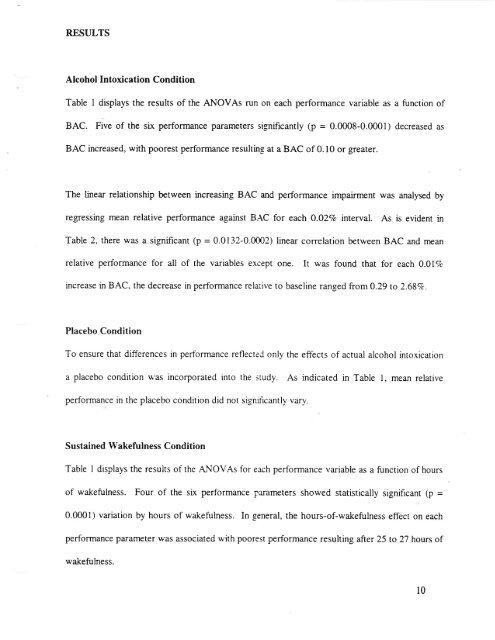
- Page 305 and 306: SUMMARY The present study systemati
- Page 307 and 308: t, While this initial study clearly
- Page 309 and 310: The simple sensory comparison task
- Page 311: eathalyser (Lion Alcolrneter S-D2,
- Page 315 and 316: DISCUSSION In the present study mod
- Page 317 and 318: alcohol intoxication and sustained
- Page 319 and 320: Participants may explain, at least
- Page 321 and 322: sustained wakefulness and actual dr
- Page 323 and 324: Fiorica, V., Higgins. E.4.. Iampiet
- Page 325 and 326: TABLE f . Summary of ANOVA results
- Page 327 and 328: .l) H^ .o -5 q, R -to It E .I.5 ax
- Page 329 and 330: o0 c .ð -5 o P -10 ..A ã e o1 -t5
- Page 331 and 332: Êro .l Ë € rn o- À IÞ -( -ro
- Page 334 and 335: '. rev, ¡atlguc Iaclot> úr dv¡ô
- Page 336 and 337: Cre t lattgue laflors m allatlon ac
- Page 338 and 339: INTERNATIONAL BROTHERHOOD OF TEAMST
- Page 340 and 341: PROPOSED REGULATORY LANGUAGE 121.xx
- Page 342 and 343: ARAC RESERVE DUTY WORKING GROUP IND
- Page 344 and 345: ARAC Reserve Duty' Worbng Group Ind
- Page 346 and 347: AR,{'C Rescn'e Dutv Work¡ng Group
- Page 348 and 349: AR.AC Resen e Dut¡' Workrng Group
- Page 350 and 351: proposal includes a provision that
- Page 352 and 353: Rest Period: ARAC Reserve Duty and
- Page 354 and 355: Attachment 2 Alternative Reserve Du
- Page 356 and 357: ARAC Flight Crew Reserve Time Worki
- Page 358 and 359: NATIONAL AIR TRANSPORTATION ASSOCIA
- Page 360 and 361: January 15, 1999 Pnrlrous REsr Foll
- Page 362 and 363:
t4910-131 DEPARÍÌ{ENT OF TRAI{SPO
- Page 364 and 365:
Admlnístrator finds necesSary for
- Page 366:
similar language is contained in Se
- Page 369 and 370:
Rest Period: ATA Proposed Reserve R
- Page 371 and 372:
i I t-. :.-::l '!i¡9 ';:r Mr. Dona
- Page 373 and 374:
ALPA's HANGAR Page 1 of2 Volume 6,
- Page 375 and 376:
Letter: FAA Interpretation of FAR 1
- Page 377 and 378:
Letter: FAA Interpretation of FAR l
- Page 379 and 380:
Letter: FAA Interpretation of FAR 1


