

LIBRARY ı6ıul 0) - Cranfield University
LIBRARY ı6ıul 0) - Cranfield University
LIBRARY ı6ıul 0) - Cranfield University

Create successful ePaper yourself
Turn your PDF publications into a flip-book with our unique Google optimized e-Paper software.
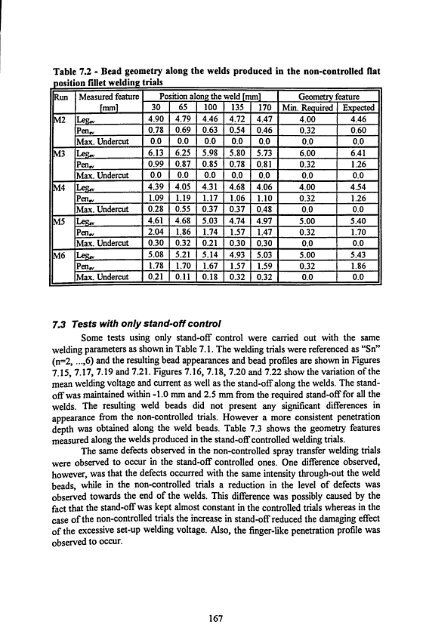
Table 7.2 - Bead geometry along the welds produced in the non-controlled flat<br />
nncitinn fillet welding trials<br />
Run Measured feature Position alon the weld mm Geometry feature<br />
mm 30 65 100 135 170 Min. Required Expected<br />
2 Leg., 4.90 4.79 4.46 4.72 4.47 4.00 4.46<br />
Pen.,, 0.78 0.69 0.63 0.54 0.46 0.32 0.60<br />
Max. Undercut 0.0 0.0 0.0 0.0 0.0 0.0 0.0<br />
3 Le 6.13 6.25 5.98 5.80 5.73 6.00 6.41<br />
Pen,. 0.99 0.87 0.85 0.78 0.81 0.32 1.26<br />
Max. Undercut 0.0 0.0 0.0 0.0 0.0 0.0 0.0<br />
M4 Le 4.39 4.05 4.31 4.68 4.06 4.00 4.54<br />
Pen,,, 1.09 1.19 1.17 1.06 1.10 0.32 1.26<br />
Max. Undercut 0.28 0.55 0.37 0.37 0.48 0.0 0.0<br />
5 Le 4.61 4.68 5.03 4.74 4.97 5.00 5.40<br />
Pen,,, 2.04 1.86 1.74 1.57 1.47 0.32 1.70<br />
Max. Undercut 0.30 0.32 0.21 0.30 0.30 0.0 0.0<br />
6 Le-gW 5.08 5.21 5.14 4.93 5.03 5.00 5.43<br />
Pen, 1.78 1.70 1.67 1.57 1.59 0.32 1.86<br />
Max. Undercut 0.21 0.11 0.18 0.32 0.32 0.0 0.0<br />
7.3 Tests with only stand-off control<br />
Some tests using only stand-off control were carried out with the same<br />
welding parameters as shown in Table 7.1. The welding trials were referenced as "Sn"<br />
(n--2,..., 6) and the resulting bead appearances<br />
and bead profiles are shown in Figures<br />
7.15,7.17,7.19 and 7.21. Figures 7.16,7.18,7.20 and 7.22 show the variation of the<br />
mean welding voltage and current as well as the stand-off along the welds. The stand-<br />
off was maintained within -1.0 mm and 2.5 mm from the required stand-off for all the<br />
welds. The resulting weld beads did not present any significant differences in<br />
appearance from the non-controlled trials. However a more consistent penetration<br />
depth was obtained along the weld beads. Table 7.3 shows the geometry features<br />
measured along the welds produced in the stand-off controlled welding trials.<br />
The same defects observed in the non-controlled spray transfer welding trials<br />
were observed to occur in the stand-off controlled ones. One difference observed,<br />
however, was that the defects occurred with the same intensity through-out the weld<br />
beads, while in the non-controlled trials a reduction in the level of defects was<br />
observed towards the end of the welds. This difference was possibly caused by the<br />
fact that the stand-off was kept almost constant in the controlled trials whereas in the<br />
case of the non-controlled trials the increase in stand-off reduced the damaging effect<br />
of the excessive set-up welding voltage. Also, the finger-like penetration profile was<br />
observed to occur.<br />
167


