

Measuring the Benefits of Intercity Passenger Rail: A Study
Measuring the Benefits of Intercity Passenger Rail: A Study
Measuring the Benefits of Intercity Passenger Rail: A Study

Create successful ePaper yourself
Turn your PDF publications into a flip-book with our unique Google optimized e-Paper software.
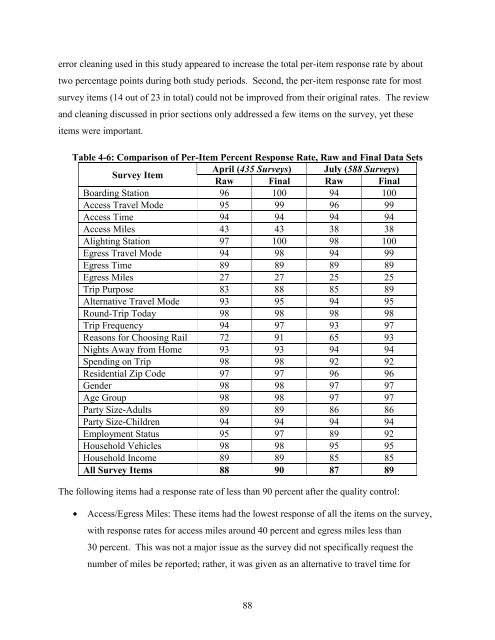
error cleaning used in this study appeared to increase <strong>the</strong> total per-item response rate by about<br />
two percentage points during both study periods. Second, <strong>the</strong> per-item response rate for most<br />
survey items (14 out <strong>of</strong> 23 in total) could not be improved from <strong>the</strong>ir original rates. The review<br />
and cleaning discussed in prior sections only addressed a few items on <strong>the</strong> survey, yet <strong>the</strong>se<br />
items were important.<br />
Table 4-6: Comparison <strong>of</strong> Per-Item Percent Response Rate, Raw and Final Data Sets<br />
Survey Item<br />
April (435 Surveys)<br />
Raw Final<br />
July (588 Surveys)<br />
Raw Final<br />
Boarding Station 96 100 94 100<br />
Access Travel Mode 95 99 96 99<br />
Access Time 94 94 94 94<br />
Access Miles 43 43 38 38<br />
Alighting Station 97 100 98 100<br />
Egress Travel Mode 94 98 94 99<br />
Egress Time 89 89 89 89<br />
Egress Miles 27 27 25 25<br />
Trip Purpose 83 88 85 89<br />
Alternative Travel Mode 93 95 94 95<br />
Round-Trip Today 98 98 98 98<br />
Trip Frequency 94 97 93 97<br />
Reasons for Choosing <strong>Rail</strong> 72 91 65 93<br />
Nights Away from Home 93 93 94 94<br />
Spending on Trip 98 98 92 92<br />
Residential Zip Code 97 97 96 96<br />
Gender 98 98 97 97<br />
Age Group 98 98 97 97<br />
Party Size-Adults 89 89 86 86<br />
Party Size-Children 94 94 94 94<br />
Employment Status 95 97 89 92<br />
Household Vehicles 98 98 95 95<br />
Household Income 89 89 85 85<br />
All Survey Items 88 90 87 89<br />
The following items had a response rate <strong>of</strong> less than 90 percent after <strong>the</strong> quality control:<br />
• Access/Egress Miles: These items had <strong>the</strong> lowest response <strong>of</strong> all <strong>the</strong> items on <strong>the</strong> survey,<br />
with response rates for access miles around 40 percent and egress miles less than<br />
30 percent. This was not a major issue as <strong>the</strong> survey did not specifically request <strong>the</strong><br />
number <strong>of</strong> miles be reported; ra<strong>the</strong>r, it was given as an alternative to travel time for<br />
88


