

Measuring the Benefits of Intercity Passenger Rail: A Study
Measuring the Benefits of Intercity Passenger Rail: A Study
Measuring the Benefits of Intercity Passenger Rail: A Study

You also want an ePaper? Increase the reach of your titles
YUMPU automatically turns print PDFs into web optimized ePapers that Google loves.
analysis, as <strong>the</strong> sample appears to reasonably approximate <strong>the</strong> ridership patterns for <strong>the</strong><br />
Heartland Flyer in CY 2008. It should be noted that <strong>the</strong> CY 2008 passenger totals include<br />
children and organized groups, two passenger segments that were excluded from this analysis.<br />
TRAVEL CHARACTERISTICS<br />
Travel characteristics examined in this analysis included Heartland Flyer passenger<br />
boarding and alighting station, mode <strong>of</strong> travel to and from stations, travel time and distance to<br />
and from stations, trip purpose, and alternative travel mode.<br />
Boarding and Alighting Station<br />
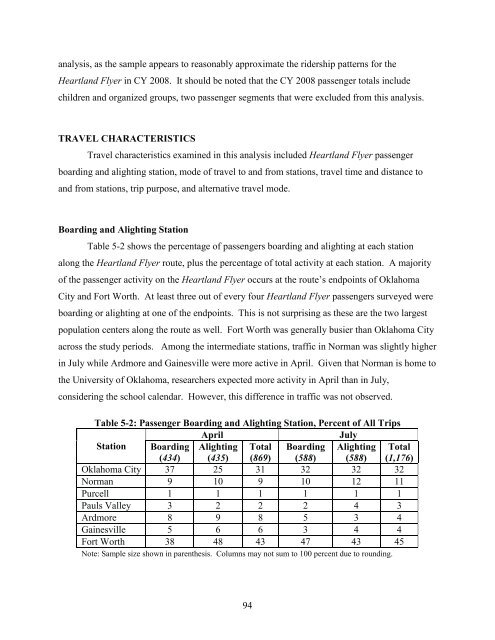
Table 5-2 shows <strong>the</strong> percentage <strong>of</strong> passengers boarding and alighting at each station<br />
along <strong>the</strong> Heartland Flyer route, plus <strong>the</strong> percentage <strong>of</strong> total activity at each station. A majority<br />
<strong>of</strong> <strong>the</strong> passenger activity on <strong>the</strong> Heartland Flyer occurs at <strong>the</strong> route’s endpoints <strong>of</strong> Oklahoma<br />
City and Fort Worth. At least three out <strong>of</strong> every four Heartland Flyer passengers surveyed were<br />
boarding or alighting at one <strong>of</strong> <strong>the</strong> endpoints. This is not surprising as <strong>the</strong>se are <strong>the</strong> two largest<br />
population centers along <strong>the</strong> route as well. Fort Worth was generally busier than Oklahoma City<br />
across <strong>the</strong> study periods. Among <strong>the</strong> intermediate stations, traffic in Norman was slightly higher<br />
in July while Ardmore and Gainesville were more active in April. Given that Norman is home to<br />
<strong>the</strong> University <strong>of</strong> Oklahoma, researchers expected more activity in April than in July,<br />
considering <strong>the</strong> school calendar. However, this difference in traffic was not observed.<br />
Table 5-2: <strong>Passenger</strong> Boarding and Alighting Station, Percent <strong>of</strong> All Trips<br />
April July<br />
Station Boarding Alighting Total Boarding Alighting Total<br />
(434) (435) (869) (588) (588) (1,176)<br />
Oklahoma City 37 25 31 32 32 32<br />
Norman 9 10 9 10 12 11<br />
Purcell 1 1 1 1 1 1<br />
Pauls Valley 3 2 2 2 4 3<br />
Ardmore 8 9 8 5 3 4<br />
Gainesville 5 6 6 3 4 4<br />
Fort Worth 38 48 43 47 43 45<br />
Note: Sample size shown in paren<strong>the</strong>sis. Columns may not sum to 100 percent due to rounding.<br />
94


