

Measuring the Benefits of Intercity Passenger Rail: A Study
Measuring the Benefits of Intercity Passenger Rail: A Study
Measuring the Benefits of Intercity Passenger Rail: A Study

Create successful ePaper yourself
Turn your PDF publications into a flip-book with our unique Google optimized e-Paper software.
if <strong>the</strong> service did not exist (approximately 70 percent <strong>of</strong> passengers) and those that would not<br />
have made <strong>the</strong> trip at all if <strong>the</strong> service did not exist (30 percent). In <strong>the</strong> context <strong>of</strong> passenger<br />
spending, any spending by passengers who reported that <strong>the</strong>y would forgo <strong>the</strong>ir trip in <strong>the</strong><br />
absence <strong>of</strong> <strong>the</strong> service would also be lost if <strong>the</strong> rail service were discontinued. Table 5-32 reports<br />
passenger spending on lodging, meals, shopping, and entertainment, by induced or non-induced<br />
trip type. Researchers developed <strong>the</strong>se estimates by multiplying average passenger spending by<br />
each trip type and study period by <strong>the</strong> estimates <strong>of</strong> induced and non-induced trips for each travel<br />
period, as reported in Table 5-27.<br />
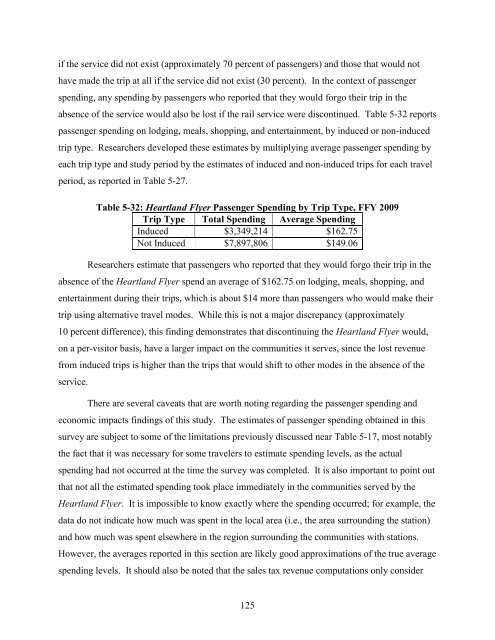
Table 5-32: Heartland Flyer <strong>Passenger</strong> Spending by Trip Type, FFY 2009<br />
Trip Type Total Spending Average Spending<br />
Induced $3,349,214 $162.75<br />
Not Induced $7,897,806 $149.06<br />
Researchers estimate that passengers who reported that <strong>the</strong>y would forgo <strong>the</strong>ir trip in <strong>the</strong><br />
absence <strong>of</strong> <strong>the</strong> Heartland Flyer spend an average <strong>of</strong> $162.75 on lodging, meals, shopping, and<br />
entertainment during <strong>the</strong>ir trips, which is about $14 more than passengers who would make <strong>the</strong>ir<br />
trip using alternative travel modes. While this is not a major discrepancy (approximately<br />
10 percent difference), this finding demonstrates that discontinuing <strong>the</strong> Heartland Flyer would,<br />
on a per-visitor basis, have a larger impact on <strong>the</strong> communities it serves, since <strong>the</strong> lost revenue<br />
from induced trips is higher than <strong>the</strong> trips that would shift to o<strong>the</strong>r modes in <strong>the</strong> absence <strong>of</strong> <strong>the</strong><br />
service.<br />
There are several caveats that are worth noting regarding <strong>the</strong> passenger spending and<br />
economic impacts findings <strong>of</strong> this study. The estimates <strong>of</strong> passenger spending obtained in this<br />
survey are subject to some <strong>of</strong> <strong>the</strong> limitations previously discussed near Table 5-17, most notably<br />
<strong>the</strong> fact that it was necessary for some travelers to estimate spending levels, as <strong>the</strong> actual<br />
spending had not occurred at <strong>the</strong> time <strong>the</strong> survey was completed. It is also important to point out<br />
that not all <strong>the</strong> estimated spending took place immediately in <strong>the</strong> communities served by <strong>the</strong><br />
Heartland Flyer. It is impossible to know exactly where <strong>the</strong> spending occurred; for example, <strong>the</strong><br />
data do not indicate how much was spent in <strong>the</strong> local area (i.e., <strong>the</strong> area surrounding <strong>the</strong> station)<br />
and how much was spent elsewhere in <strong>the</strong> region surrounding <strong>the</strong> communities with stations.<br />
However, <strong>the</strong> averages reported in this section are likely good approximations <strong>of</strong> <strong>the</strong> true average<br />
spending levels. It should also be noted that <strong>the</strong> sales tax revenue computations only consider<br />
125


