

Measuring the Benefits of Intercity Passenger Rail: A Study
Measuring the Benefits of Intercity Passenger Rail: A Study
Measuring the Benefits of Intercity Passenger Rail: A Study

You also want an ePaper? Increase the reach of your titles
YUMPU automatically turns print PDFs into web optimized ePapers that Google loves.
survey item by <strong>the</strong> total number <strong>of</strong> valid samples for that survey item. Responses <strong>of</strong> “o<strong>the</strong>r,”<br />
multiple responses, and non-response were considered not valid for <strong>the</strong> analysis and not included<br />
in <strong>the</strong> computations. Categories were generally defined by <strong>the</strong> choice set in <strong>the</strong> survey for each<br />
survey item. For open questions, researchers grouped <strong>the</strong> responses into categories based on<br />
logical break-points for <strong>the</strong> analysis. Access and egress time and distance were assigned ranges.<br />
Residential zip codes were classified as being in Oklahoma, Texas, or o<strong>the</strong>r based on <strong>the</strong><br />
response. The number <strong>of</strong> adults and children in <strong>the</strong> travel party were assigned categories for<br />
integer responses up to five adults and three children, with a final category for each being any<br />
responses greater than those values.<br />
The final statistical consideration for this analysis is <strong>the</strong> treatment <strong>of</strong> bias in <strong>the</strong> sample<br />
set. Bias refers to <strong>the</strong> difference between <strong>the</strong> characteristics <strong>of</strong> <strong>the</strong> sample and <strong>the</strong> characteristics<br />
<strong>of</strong> <strong>the</strong> population. Some issues with bias can be addressed using <strong>the</strong> stratified random sampling<br />
or cluster sampling schemes discussed previously; however, since this study did not formally<br />
employ ei<strong>the</strong>r <strong>of</strong> <strong>the</strong>se strategies, <strong>the</strong> possible bias can only be identified and included in <strong>the</strong><br />
context <strong>of</strong> <strong>the</strong> study findings. To examine possible bias in <strong>the</strong> data set, passenger counts by day<br />
<strong>of</strong> <strong>the</strong> week for calendar year (CY) 2008 were summarized and compared with <strong>the</strong> sample<br />
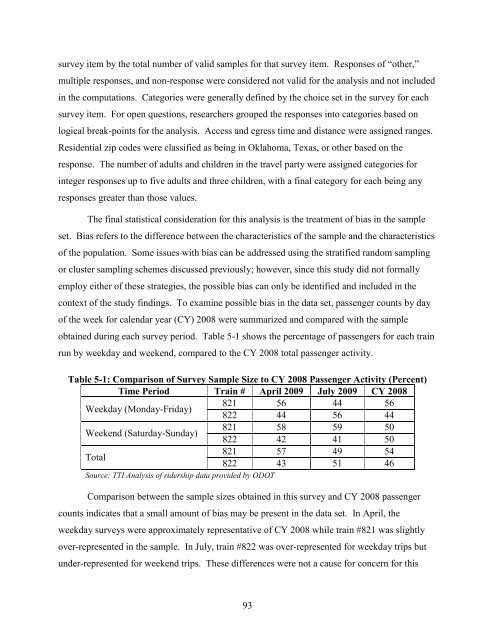
obtained during each survey period. Table 5-1 shows <strong>the</strong> percentage <strong>of</strong> passengers for each train<br />
run by weekday and weekend, compared to <strong>the</strong> CY 2008 total passenger activity.<br />
Table 5-1: Comparison <strong>of</strong> Survey Sample Size to CY 2008 <strong>Passenger</strong> Activity (Percent)<br />
Time Period Train # April 2009 July 2009 CY 2008<br />
Weekday (Monday-Friday)<br />
821<br />
822<br />
56<br />
44<br />
44<br />
56<br />
56<br />
44<br />
Weekend (Saturday-Sunday)<br />
821<br />
822<br />
58<br />
42<br />
59<br />
41<br />
50<br />
50<br />
Total<br />
821<br />
822<br />
57<br />
43<br />
49<br />
51<br />
54<br />
46<br />
Source: TTI Analysis <strong>of</strong> ridership data provided by ODOT<br />
Comparison between <strong>the</strong> sample sizes obtained in this survey and CY 2008 passenger<br />
counts indicates that a small amount <strong>of</strong> bias may be present in <strong>the</strong> data set. In April, <strong>the</strong><br />
weekday surveys were approximately representative <strong>of</strong> CY 2008 while train #821 was slightly<br />
over-represented in <strong>the</strong> sample. In July, train #822 was over-represented for weekday trips but<br />
under-represented for weekend trips. These differences were not a cause for concern for this<br />
93


