

Measuring the Benefits of Intercity Passenger Rail: A Study
Measuring the Benefits of Intercity Passenger Rail: A Study
Measuring the Benefits of Intercity Passenger Rail: A Study

Create successful ePaper yourself
Turn your PDF publications into a flip-book with our unique Google optimized e-Paper software.
In both April and July, <strong>the</strong> two most frequently cited reasons for choosing <strong>the</strong> Heartland<br />
Flyer were passenger comfort and cost, with more than a third <strong>of</strong> passengers reporting <strong>the</strong>se two<br />
reasons. The next two most frequently cited reasons were related to automobile travel, with<br />
“Would Ra<strong>the</strong>r Not Drive” and “Avoid Traffic Congestion/Parking” cited 20 percent and<br />
12 percent <strong>of</strong> <strong>the</strong> time, respectively. Among <strong>the</strong> less-frequently cited reasons, “No Vehicle<br />
Available” and “Do Not Drive” were listed by some travelers, suggesting that <strong>the</strong> Heartland<br />
Flyer facilitates travel for <strong>the</strong> non-automobile or “transit-dependent” population. Preference to<br />
avoid (or fear <strong>of</strong>?) flying was also cited by around 5 percent <strong>of</strong> respondents. The availability <strong>of</strong><br />
on-board food service was cited by very few respondents as a reason to ride <strong>the</strong> Heartland Flyer.<br />
While it might not have been one <strong>of</strong> <strong>the</strong> two most important reasons why passengers chose to<br />
ride <strong>the</strong> train, food and beverage revenue (and researcher experience) suggest that <strong>the</strong> elimination<br />
<strong>of</strong> <strong>the</strong> on-board café would likely be met with a negative response from riders.<br />
<strong>Passenger</strong> Spending on Trip<br />
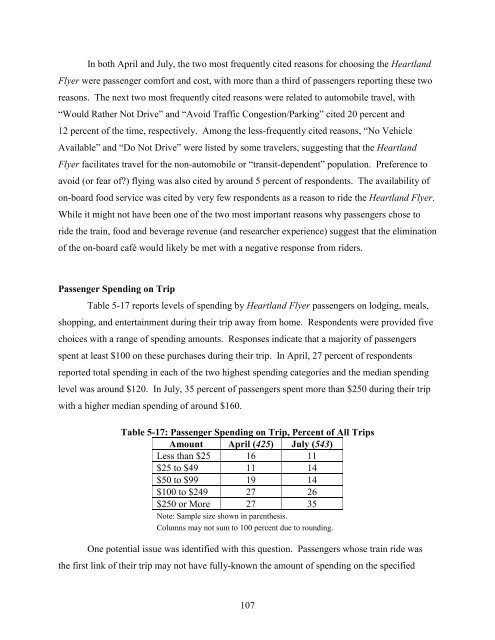
Table 5-17 reports levels <strong>of</strong> spending by Heartland Flyer passengers on lodging, meals,<br />
shopping, and entertainment during <strong>the</strong>ir trip away from home. Respondents were provided five<br />
choices with a range <strong>of</strong> spending amounts. Responses indicate that a majority <strong>of</strong> passengers<br />
spent at least $100 on <strong>the</strong>se purchases during <strong>the</strong>ir trip. In April, 27 percent <strong>of</strong> respondents<br />
reported total spending in each <strong>of</strong> <strong>the</strong> two highest spending categories and <strong>the</strong> median spending<br />
level was around $120. In July, 35 percent <strong>of</strong> passengers spent more than $250 during <strong>the</strong>ir trip<br />
with a higher median spending <strong>of</strong> around $160.<br />
Table 5-17: <strong>Passenger</strong> Spending on Trip, Percent <strong>of</strong> All Trips<br />
Amount April (425) July (543)<br />
Less than $25 16 11<br />
$25 to $49 11 14<br />
$50 to $99 19 14<br />
$100 to $249 27 26<br />
$250 or More 27 35<br />
Note: Sample size shown in paren<strong>the</strong>sis.<br />
Columns may not sum to 100 percent due to rounding.<br />
One potential issue was identified with this question. <strong>Passenger</strong>s whose train ride was<br />
<strong>the</strong> first link <strong>of</strong> <strong>the</strong>ir trip may not have fully-known <strong>the</strong> amount <strong>of</strong> spending on <strong>the</strong> specified<br />
107


