

Measuring the Benefits of Intercity Passenger Rail: A Study
Measuring the Benefits of Intercity Passenger Rail: A Study
Measuring the Benefits of Intercity Passenger Rail: A Study

Create successful ePaper yourself
Turn your PDF publications into a flip-book with our unique Google optimized e-Paper software.
items but ra<strong>the</strong>r estimated based upon <strong>the</strong> respondent’s intended spending levels. However,<br />
researchers suspect that <strong>the</strong>se responses were likely conservative estimates. Ano<strong>the</strong>r issue for<br />
<strong>the</strong>se responses is that for certain types <strong>of</strong> trips, this question may not seem applicable (i.e.,<br />
passenger moving from one permanent residence to ano<strong>the</strong>r). The “Economic Impacts” section<br />
<strong>of</strong> this chapter provides more detailed analysis <strong>of</strong> <strong>the</strong> response to this survey item.<br />
Residential Location<br />
The first demographic item on this survey was <strong>the</strong> passenger’s self-reported home zip<br />
code. In <strong>the</strong> urban transit application, a more precise measure for a passenger’s residential<br />
location is necessary for <strong>the</strong> data to be useful. However, for intercity travel, <strong>the</strong> passenger’s<br />
home zip code is a sufficient approximation to identify where passengers live or for o<strong>the</strong>r<br />
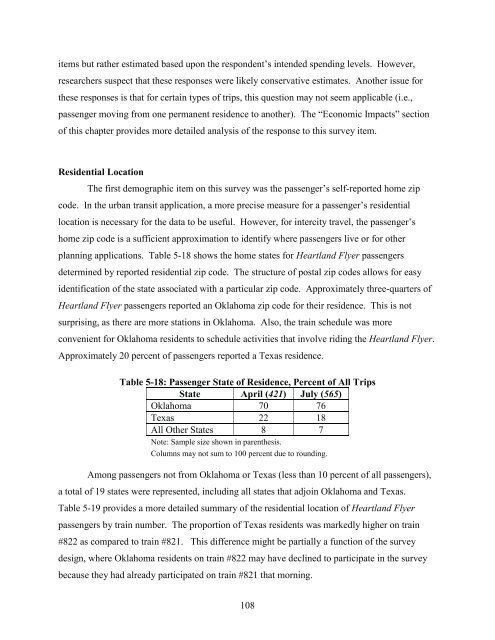
planning applications. Table 5-18 shows <strong>the</strong> home states for Heartland Flyer passengers<br />
determined by reported residential zip code. The structure <strong>of</strong> postal zip codes allows for easy<br />
identification <strong>of</strong> <strong>the</strong> state associated with a particular zip code. Approximately three-quarters <strong>of</strong><br />
Heartland Flyer passengers reported an Oklahoma zip code for <strong>the</strong>ir residence. This is not<br />
surprising, as <strong>the</strong>re are more stations in Oklahoma. Also, <strong>the</strong> train schedule was more<br />
convenient for Oklahoma residents to schedule activities that involve riding <strong>the</strong> Heartland Flyer.<br />
Approximately 20 percent <strong>of</strong> passengers reported a Texas residence.<br />
Table 5-18: <strong>Passenger</strong> State <strong>of</strong> Residence, Percent <strong>of</strong> All Trips<br />
State April (421) July (565)<br />
Oklahoma 70 76<br />
Texas 22 18<br />
All O<strong>the</strong>r States 8 7<br />
Note: Sample size shown in paren<strong>the</strong>sis.<br />
Columns may not sum to 100 percent due to rounding.<br />
Among passengers not from Oklahoma or Texas (less than 10 percent <strong>of</strong> all passengers),<br />
a total <strong>of</strong> 19 states were represented, including all states that adjoin Oklahoma and Texas.<br />
Table 5-19 provides a more detailed summary <strong>of</strong> <strong>the</strong> residential location <strong>of</strong> Heartland Flyer<br />
passengers by train number. The proportion <strong>of</strong> Texas residents was markedly higher on train<br />
#822 as compared to train #821. This difference might be partially a function <strong>of</strong> <strong>the</strong> survey<br />
design, where Oklahoma residents on train #822 may have declined to participate in <strong>the</strong> survey<br />
because <strong>the</strong>y had already participated on train #821 that morning.<br />
108


