

Measuring the Benefits of Intercity Passenger Rail: A Study
Measuring the Benefits of Intercity Passenger Rail: A Study
Measuring the Benefits of Intercity Passenger Rail: A Study

Create successful ePaper yourself
Turn your PDF publications into a flip-book with our unique Google optimized e-Paper software.
sales tax and do not include hotel occupancy or o<strong>the</strong>r special taxes that a community might have<br />
in place. Including <strong>the</strong> revenue projections from <strong>the</strong>se taxes would likely increase <strong>the</strong> overall tax<br />
generation attributed to <strong>the</strong> Heartland Flyer service. Finally, <strong>the</strong> computations in this section<br />
only address <strong>the</strong> economic impacts related to passenger spending and do not consider any<br />
“multiplier” effects from <strong>the</strong> spending. If <strong>the</strong>se effects were incorporated, <strong>the</strong>y would likely<br />
increase <strong>the</strong> impacts <strong>of</strong> <strong>the</strong> Heartland Flyer service beyond what was identified in this analysis.<br />
SUMMARY OF ANALYSIS FINDINGS<br />
The on-board survey <strong>of</strong> Heartland Flyer passengers in this research study resulted in an<br />
extensive database <strong>of</strong> traveler information from which to gain insight into <strong>the</strong> impacts <strong>of</strong><br />
passenger rail in a short- to medium-distance intercity corridor. The analysis <strong>of</strong> this database<br />
described in this chapter revealed some expected and unexpected findings. Frequently cited trip<br />
purposes among Heartland Flyer passengers were primarily non-business trips, including trips to<br />
visit family and friends and leisure/recreation trips. These trips accounted for more than<br />
75 percent <strong>of</strong> <strong>the</strong> total passengers surveyed. Automobile was reported as <strong>the</strong> primary alternative<br />
to <strong>the</strong> Heartland Flyer service (60 percent), but 30 percent <strong>of</strong> respondents indicated that <strong>the</strong>y<br />
would not make <strong>the</strong> trip if <strong>the</strong> service were discontinued. Primary reasons for choosing <strong>the</strong><br />
Heartland Flyer included train comfort and cost. Approximately 70 percent <strong>of</strong> passengers<br />
reported an Oklahoma zip code for <strong>the</strong>ir residence, while 20 percent were from Texas.<br />
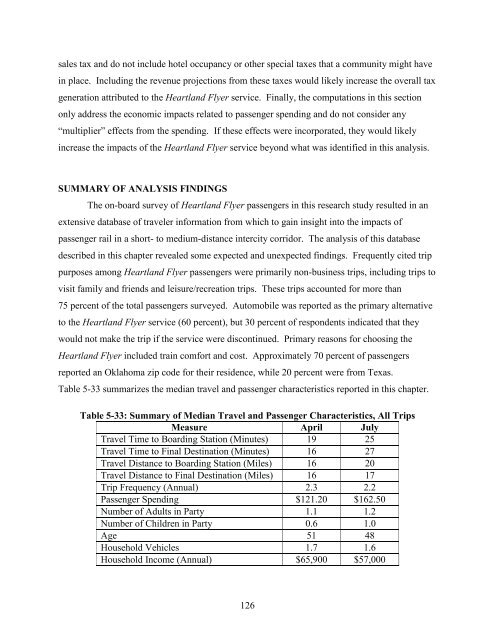
Table 5-33 summarizes <strong>the</strong> median travel and passenger characteristics reported in this chapter.<br />
Table 5-33: Summary <strong>of</strong> Median Travel and <strong>Passenger</strong> Characteristics, All Trips<br />
Measure April July<br />
Travel Time to Boarding Station (Minutes) 19 25<br />
Travel Time to Final Destination (Minutes) 16 27<br />
Travel Distance to Boarding Station (Miles) 16 20<br />
Travel Distance to Final Destination (Miles) 16 17<br />
Trip Frequency (Annual) 2.3 2.2<br />
<strong>Passenger</strong> Spending $121.20 $162.50<br />
Number <strong>of</strong> Adults in Party 1.1 1.2<br />
Number <strong>of</strong> Children in Party 0.6 1.0<br />
Age 51 48<br />
Household Vehicles 1.7 1.6<br />
Household Income (Annual) $65,900 $57,000<br />
126


