

Measuring the Benefits of Intercity Passenger Rail: A Study
Measuring the Benefits of Intercity Passenger Rail: A Study
Measuring the Benefits of Intercity Passenger Rail: A Study

You also want an ePaper? Increase the reach of your titles
YUMPU automatically turns print PDFs into web optimized ePapers that Google loves.
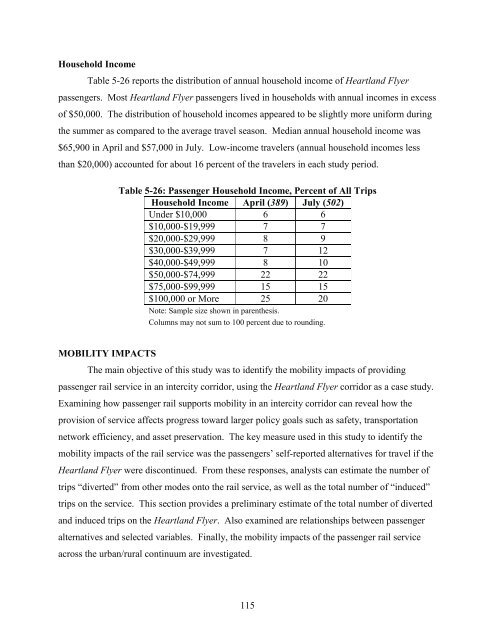
Household Income<br />
Table 5-26 reports <strong>the</strong> distribution <strong>of</strong> annual household income <strong>of</strong> Heartland Flyer<br />
passengers. Most Heartland Flyer passengers lived in households with annual incomes in excess<br />
<strong>of</strong> $50,000. The distribution <strong>of</strong> household incomes appeared to be slightly more uniform during<br />
<strong>the</strong> summer as compared to <strong>the</strong> average travel season. Median annual household income was<br />
$65,900 in April and $57,000 in July. Low-income travelers (annual household incomes less<br />
than $20,000) accounted for about 16 percent <strong>of</strong> <strong>the</strong> travelers in each study period.<br />
Table 5-26: <strong>Passenger</strong> Household Income, Percent <strong>of</strong> All Trips<br />
Household Income April (389) July (502)<br />
Under $10,000 6 6<br />
$10,000-$19,999 7 7<br />
$20,000-$29,999 8 9<br />
$30,000-$39,999 7 12<br />
$40,000-$49,999 8 10<br />
$50,000-$74,999 22 22<br />
$75,000-$99,999 15 15<br />
$100,000 or More 25 20<br />
Note: Sample size shown in paren<strong>the</strong>sis.<br />
Columns may not sum to 100 percent due to rounding.<br />
MOBILITY IMPACTS<br />
The main objective <strong>of</strong> this study was to identify <strong>the</strong> mobility impacts <strong>of</strong> providing<br />
passenger rail service in an intercity corridor, using <strong>the</strong> Heartland Flyer corridor as a case study.<br />
Examining how passenger rail supports mobility in an intercity corridor can reveal how <strong>the</strong><br />
provision <strong>of</strong> service affects progress toward larger policy goals such as safety, transportation<br />
network efficiency, and asset preservation. The key measure used in this study to identify <strong>the</strong><br />
mobility impacts <strong>of</strong> <strong>the</strong> rail service was <strong>the</strong> passengers’ self-reported alternatives for travel if <strong>the</strong><br />
Heartland Flyer were discontinued. From <strong>the</strong>se responses, analysts can estimate <strong>the</strong> number <strong>of</strong><br />
trips “diverted” from o<strong>the</strong>r modes onto <strong>the</strong> rail service, as well as <strong>the</strong> total number <strong>of</strong> “induced”<br />
trips on <strong>the</strong> service. This section provides a preliminary estimate <strong>of</strong> <strong>the</strong> total number <strong>of</strong> diverted<br />
and induced trips on <strong>the</strong> Heartland Flyer. Also examined are relationships between passenger<br />
alternatives and selected variables. Finally, <strong>the</strong> mobility impacts <strong>of</strong> <strong>the</strong> passenger rail service<br />
across <strong>the</strong> urban/rural continuum are investigated.<br />
115


