

Measuring the Benefits of Intercity Passenger Rail: A Study
Measuring the Benefits of Intercity Passenger Rail: A Study
Measuring the Benefits of Intercity Passenger Rail: A Study

You also want an ePaper? Increase the reach of your titles
YUMPU automatically turns print PDFs into web optimized ePapers that Google loves.
passenger was approximately $120 in April and $160 in July (see Table 5-17). Additional<br />
analysis <strong>of</strong> survey responses to this question follows.<br />
One potential economic benefit <strong>of</strong> passenger rail service that researchers could easily<br />
identify from <strong>the</strong> survey responses was <strong>the</strong> spending level <strong>of</strong> passengers at <strong>the</strong>ir destination, both<br />
total spending and <strong>the</strong> associated sales tax revenue. Table 5-31 provides a summary <strong>of</strong> <strong>the</strong><br />
average passenger spending level and <strong>the</strong> sales tax revenue for each “destination” station area.<br />
Researchers assigned a “destination” station to each survey record based on factors including <strong>the</strong><br />
boarding and alighting station and <strong>the</strong> passenger’s residential zip code. Destination stations with<br />
passenger spending responses were identified for 417 survey records in <strong>the</strong> April data set<br />
(96 percent) and for 531 records in <strong>the</strong> July data set (90 percent). Researchers computed <strong>the</strong><br />
average passenger spending level at each station per study period by using a midpoint value<br />
assigned to each range <strong>of</strong> spending given as choices on <strong>the</strong> survey form. Total spending was<br />
<strong>the</strong>n calculated by distributing <strong>the</strong> average spending level for each station across <strong>the</strong> FFY 2009<br />
boarding and alighting totals (see Table 3-4) for each station to ei<strong>the</strong>r peak or non-peak travel<br />
seasons. An adjustment was made to <strong>the</strong> passenger activity in Fort Worth to account for<br />
passengers transferring to <strong>the</strong> Texas Eagle, as <strong>the</strong> expenditures by <strong>the</strong>se passengers do not<br />
remain in <strong>the</strong> Fort Worth area. Table 5-31 also reports sales tax rates for each community served<br />
by <strong>the</strong> Heartland Flyer, provided by <strong>the</strong> Oklahoma Tax Commission and <strong>the</strong> Texas State<br />
Comptroller <strong>of</strong> Public Accounts. Researchers applied <strong>the</strong>se tax rates to <strong>the</strong> passenger spending<br />
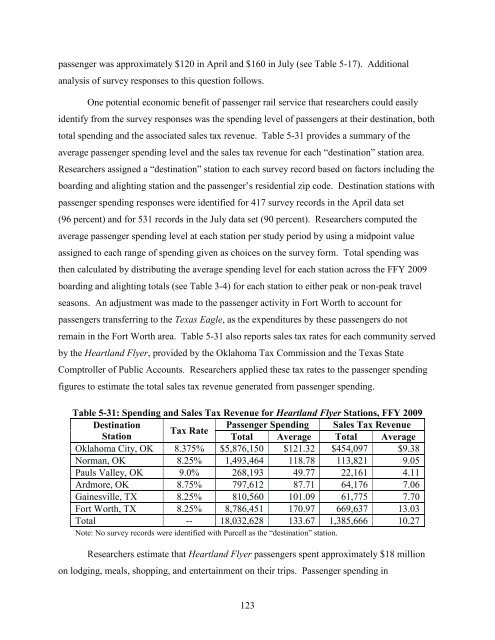
figures to estimate <strong>the</strong> total sales tax revenue generated from passenger spending.<br />
Table 5-31: Spending and Sales Tax Revenue for Heartland Flyer Stations, FFY 2009<br />
Destination<br />
Station<br />
Tax Rate<br />
<strong>Passenger</strong> Spending<br />
Total Average<br />
Sales Tax Revenue<br />
Total Average<br />
Oklahoma City, OK 8.375% $5,876,150 $121.32 $454,097 $9.38<br />
Norman, OK 8.25% 1,493,464 118.78 113,821 9.05<br />
Pauls Valley, OK 9.0% 268,193 49.77 22,161 4.11<br />
Ardmore, OK 8.75% 797,612 87.71 64,176 7.06<br />
Gainesville, TX 8.25% 810,560 101.09 61,775 7.70<br />
Fort Worth, TX 8.25% 8,786,451 170.97 669,637 13.03<br />
Total -- 18,032,628 133.67 1,385,666 10.27<br />
Note: No survey records were identified with Purcell as <strong>the</strong> “destination” station.<br />
Researchers estimate that Heartland Flyer passengers spent approximately $18 million<br />
on lodging, meals, shopping, and entertainment on <strong>the</strong>ir trips. <strong>Passenger</strong> spending in<br />
123


