

Measuring the Benefits of Intercity Passenger Rail: A Study
Measuring the Benefits of Intercity Passenger Rail: A Study
Measuring the Benefits of Intercity Passenger Rail: A Study

You also want an ePaper? Increase the reach of your titles
YUMPU automatically turns print PDFs into web optimized ePapers that Google loves.
Diverted and Induced Trips<br />
In this study, researchers defined a diverted trip as a trip that would have been made on<br />
an alternative travel mode in <strong>the</strong> absence <strong>of</strong> <strong>the</strong> Heartland Flyer service. Alternative travel<br />
modes to <strong>the</strong> Heartland Flyer rail service included:<br />
• Driver or <strong>Passenger</strong> <strong>of</strong> a Private Automobile;<br />
• Rental Car or Company Vehicle;<br />
• Commercial Airline; or<br />
• <strong>Intercity</strong> Bus.<br />
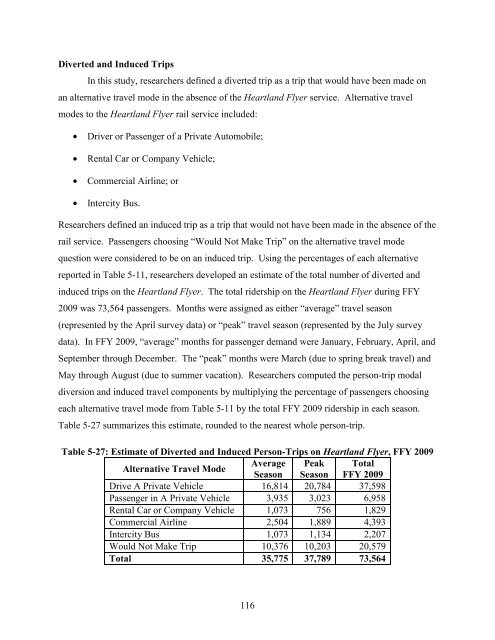
Researchers defined an induced trip as a trip that would not have been made in <strong>the</strong> absence <strong>of</strong> <strong>the</strong><br />
rail service. <strong>Passenger</strong>s choosing “Would Not Make Trip” on <strong>the</strong> alternative travel mode<br />
question were considered to be on an induced trip. Using <strong>the</strong> percentages <strong>of</strong> each alternative<br />
reported in Table 5-11, researchers developed an estimate <strong>of</strong> <strong>the</strong> total number <strong>of</strong> diverted and<br />
induced trips on <strong>the</strong> Heartland Flyer. The total ridership on <strong>the</strong> Heartland Flyer during FFY<br />
2009 was 73,564 passengers. Months were assigned as ei<strong>the</strong>r “average” travel season<br />
(represented by <strong>the</strong> April survey data) or “peak” travel season (represented by <strong>the</strong> July survey<br />
data). In FFY 2009, “average” months for passenger demand were January, February, April, and<br />
September through December. The “peak” months were March (due to spring break travel) and<br />
May through August (due to summer vacation). Researchers computed <strong>the</strong> person-trip modal<br />
diversion and induced travel components by multiplying <strong>the</strong> percentage <strong>of</strong> passengers choosing<br />
each alternative travel mode from Table 5-11 by <strong>the</strong> total FFY 2009 ridership in each season.<br />
Table 5-27 summarizes this estimate, rounded to <strong>the</strong> nearest whole person-trip.<br />
Table 5-27: Estimate <strong>of</strong> Diverted and Induced Person-Trips on Heartland Flyer, FFY 2009<br />
Alternative Travel Mode<br />
Average<br />
Season<br />
Peak<br />
Season<br />
Total<br />
FFY 2009<br />
Drive A Private Vehicle 16,814 20,784 37,598<br />
<strong>Passenger</strong> in A Private Vehicle 3,935 3,023 6,958<br />
Rental Car or Company Vehicle 1,073 756 1,829<br />
Commercial Airline 2,504 1,889 4,393<br />
<strong>Intercity</strong> Bus 1,073 1,134 2,207<br />
Would Not Make Trip 10,376 10,203 20,579<br />
Total 35,775 37,789 73,564<br />
116


