

Measuring the Benefits of Intercity Passenger Rail: A Study
Measuring the Benefits of Intercity Passenger Rail: A Study
Measuring the Benefits of Intercity Passenger Rail: A Study

You also want an ePaper? Increase the reach of your titles
YUMPU automatically turns print PDFs into web optimized ePapers that Google loves.
epresented approximately 4 percent <strong>of</strong> <strong>the</strong> ridership, reflecting a similar trend that was displayed<br />
in <strong>the</strong> summary <strong>of</strong> passenger trip purposes. Non-college students included passengers traveling<br />
to <strong>the</strong> Job Corps training center in Guthrie, Oklahoma.<br />
Table 5-24: <strong>Passenger</strong> Employment Status, Percent <strong>of</strong> All Trips<br />
Employment Status April (424) July (539)<br />
Employed Full-Time 49 55<br />
Employed Part-Time 5 6<br />
Unemployed 5 3<br />
University/College Student 4 4<br />
Student (O<strong>the</strong>r Than College) 1 1<br />
Retired 27 24<br />
Homemaker 9 7<br />
Note: Sample size shown in paren<strong>the</strong>sis. Columns may not sum to 100 percent due to rounding.<br />
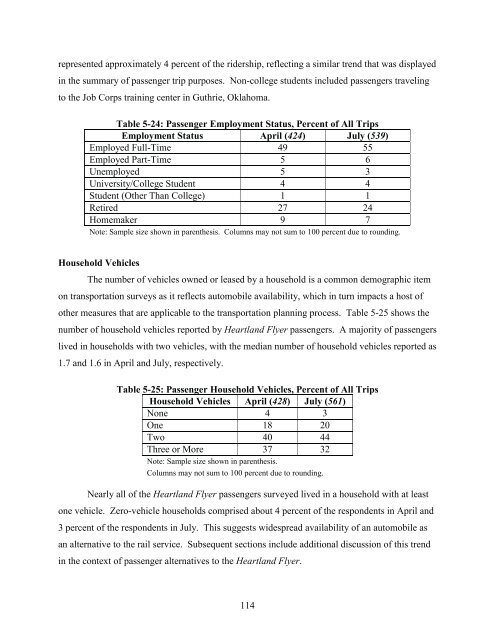
Household Vehicles<br />
The number <strong>of</strong> vehicles owned or leased by a household is a common demographic item<br />
on transportation surveys as it reflects automobile availability, which in turn impacts a host <strong>of</strong><br />
o<strong>the</strong>r measures that are applicable to <strong>the</strong> transportation planning process. Table 5-25 shows <strong>the</strong><br />
number <strong>of</strong> household vehicles reported by Heartland Flyer passengers. A majority <strong>of</strong> passengers<br />
lived in households with two vehicles, with <strong>the</strong> median number <strong>of</strong> household vehicles reported as<br />
1.7 and 1.6 in April and July, respectively.<br />
Table 5-25: <strong>Passenger</strong> Household Vehicles, Percent <strong>of</strong> All Trips<br />
Household Vehicles April (428) July (561)<br />
None 4 3<br />
One 18 20<br />
Two 40 44<br />
Three or More 37 32<br />
Note: Sample size shown in paren<strong>the</strong>sis.<br />
Columns may not sum to 100 percent due to rounding.<br />
Nearly all <strong>of</strong> <strong>the</strong> Heartland Flyer passengers surveyed lived in a household with at least<br />
one vehicle. Zero-vehicle households comprised about 4 percent <strong>of</strong> <strong>the</strong> respondents in April and<br />
3 percent <strong>of</strong> <strong>the</strong> respondents in July. This suggests widespread availability <strong>of</strong> an automobile as<br />
an alternative to <strong>the</strong> rail service. Subsequent sections include additional discussion <strong>of</strong> this trend<br />
in <strong>the</strong> context <strong>of</strong> passenger alternatives to <strong>the</strong> Heartland Flyer.<br />
114


