

Measuring the Benefits of Intercity Passenger Rail: A Study
Measuring the Benefits of Intercity Passenger Rail: A Study
Measuring the Benefits of Intercity Passenger Rail: A Study

Create successful ePaper yourself
Turn your PDF publications into a flip-book with our unique Google optimized e-Paper software.
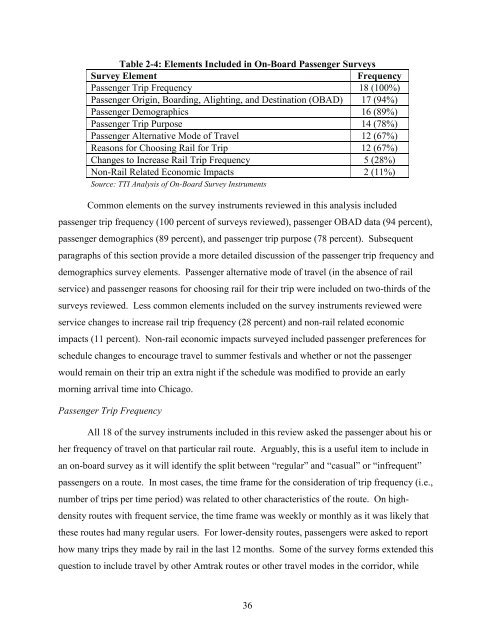
Table 2-4: Elements Included in On-Board <strong>Passenger</strong> Surveys<br />
Survey Element Frequency<br />
<strong>Passenger</strong> Trip Frequency 18 (100%)<br />
<strong>Passenger</strong> Origin, Boarding, Alighting, and Destination (OBAD) 17 (94%)<br />
<strong>Passenger</strong> Demographics 16 (89%)<br />
<strong>Passenger</strong> Trip Purpose 14 (78%)<br />
<strong>Passenger</strong> Alternative Mode <strong>of</strong> Travel 12 (67%)<br />
Reasons for Choosing <strong>Rail</strong> for Trip 12 (67%)<br />
Changes to Increase <strong>Rail</strong> Trip Frequency 5 (28%)<br />
Non-<strong>Rail</strong> Related Economic Impacts 2 (11%)<br />
Source: TTI Analysis <strong>of</strong> On-Board Survey Instruments<br />
Common elements on <strong>the</strong> survey instruments reviewed in this analysis included<br />
passenger trip frequency (100 percent <strong>of</strong> surveys reviewed), passenger OBAD data (94 percent),<br />
passenger demographics (89 percent), and passenger trip purpose (78 percent). Subsequent<br />
paragraphs <strong>of</strong> this section provide a more detailed discussion <strong>of</strong> <strong>the</strong> passenger trip frequency and<br />
demographics survey elements. <strong>Passenger</strong> alternative mode <strong>of</strong> travel (in <strong>the</strong> absence <strong>of</strong> rail<br />
service) and passenger reasons for choosing rail for <strong>the</strong>ir trip were included on two-thirds <strong>of</strong> <strong>the</strong><br />
surveys reviewed. Less common elements included on <strong>the</strong> survey instruments reviewed were<br />
service changes to increase rail trip frequency (28 percent) and non-rail related economic<br />
impacts (11 percent). Non-rail economic impacts surveyed included passenger preferences for<br />
schedule changes to encourage travel to summer festivals and whe<strong>the</strong>r or not <strong>the</strong> passenger<br />
would remain on <strong>the</strong>ir trip an extra night if <strong>the</strong> schedule was modified to provide an early<br />
morning arrival time into Chicago.<br />
<strong>Passenger</strong> Trip Frequency<br />
All 18 <strong>of</strong> <strong>the</strong> survey instruments included in this review asked <strong>the</strong> passenger about his or<br />
her frequency <strong>of</strong> travel on that particular rail route. Arguably, this is a useful item to include in<br />
an on-board survey as it will identify <strong>the</strong> split between “regular” and “casual” or “infrequent”<br />
passengers on a route. In most cases, <strong>the</strong> time frame for <strong>the</strong> consideration <strong>of</strong> trip frequency (i.e.,<br />
number <strong>of</strong> trips per time period) was related to o<strong>the</strong>r characteristics <strong>of</strong> <strong>the</strong> route. On highdensity<br />
routes with frequent service, <strong>the</strong> time frame was weekly or monthly as it was likely that<br />
<strong>the</strong>se routes had many regular users. For lower-density routes, passengers were asked to report<br />
how many trips <strong>the</strong>y made by rail in <strong>the</strong> last 12 months. Some <strong>of</strong> <strong>the</strong> survey forms extended this<br />
question to include travel by o<strong>the</strong>r Amtrak routes or o<strong>the</strong>r travel modes in <strong>the</strong> corridor, while<br />
36


