

Measuring the Benefits of Intercity Passenger Rail: A Study
Measuring the Benefits of Intercity Passenger Rail: A Study
Measuring the Benefits of Intercity Passenger Rail: A Study

You also want an ePaper? Increase the reach of your titles
YUMPU automatically turns print PDFs into web optimized ePapers that Google loves.
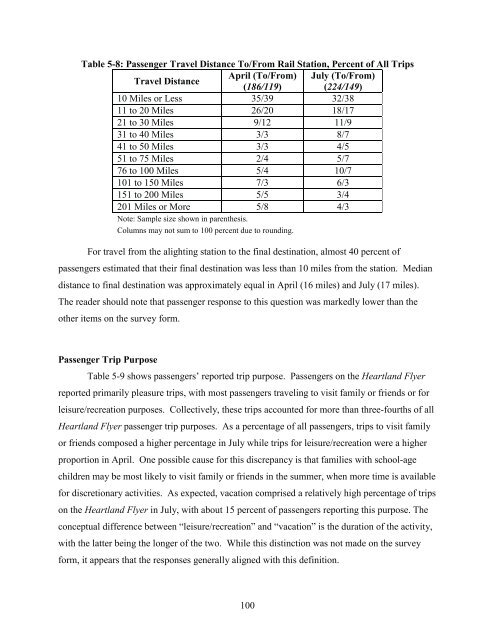
Table 5-8: <strong>Passenger</strong> Travel Distance To/From <strong>Rail</strong> Station, Percent <strong>of</strong> All Trips<br />
Travel Distance<br />
April (To/From)<br />
(186/119)<br />
July (To/From)<br />
(224/149)<br />
10 Miles or Less 35/39 32/38<br />
11 to 20 Miles 26/20 18/17<br />
21 to 30 Miles 9/12 11/9<br />
31 to 40 Miles 3/3 8/7<br />
41 to 50 Miles 3/3 4/5<br />
51 to 75 Miles 2/4 5/7<br />
76 to 100 Miles 5/4 10/7<br />
101 to 150 Miles 7/3 6/3<br />
151 to 200 Miles 5/5 3/4<br />
201 Miles or More 5/8 4/3<br />
Note: Sample size shown in paren<strong>the</strong>sis.<br />
Columns may not sum to 100 percent due to rounding.<br />
For travel from <strong>the</strong> alighting station to <strong>the</strong> final destination, almost 40 percent <strong>of</strong><br />
passengers estimated that <strong>the</strong>ir final destination was less than 10 miles from <strong>the</strong> station. Median<br />
distance to final destination was approximately equal in April (16 miles) and July (17 miles).<br />
The reader should note that passenger response to this question was markedly lower than <strong>the</strong><br />
o<strong>the</strong>r items on <strong>the</strong> survey form.<br />
<strong>Passenger</strong> Trip Purpose<br />
Table 5-9 shows passengers’ reported trip purpose. <strong>Passenger</strong>s on <strong>the</strong> Heartland Flyer<br />
reported primarily pleasure trips, with most passengers traveling to visit family or friends or for<br />
leisure/recreation purposes. Collectively, <strong>the</strong>se trips accounted for more than three-fourths <strong>of</strong> all<br />
Heartland Flyer passenger trip purposes. As a percentage <strong>of</strong> all passengers, trips to visit family<br />
or friends composed a higher percentage in July while trips for leisure/recreation were a higher<br />
proportion in April. One possible cause for this discrepancy is that families with school-age<br />
children may be most likely to visit family or friends in <strong>the</strong> summer, when more time is available<br />
for discretionary activities. As expected, vacation comprised a relatively high percentage <strong>of</strong> trips<br />
on <strong>the</strong> Heartland Flyer in July, with about 15 percent <strong>of</strong> passengers reporting this purpose. The<br />
conceptual difference between “leisure/recreation” and “vacation” is <strong>the</strong> duration <strong>of</strong> <strong>the</strong> activity,<br />
with <strong>the</strong> latter being <strong>the</strong> longer <strong>of</strong> <strong>the</strong> two. While this distinction was not made on <strong>the</strong> survey<br />
form, it appears that <strong>the</strong> responses generally aligned with this definition.<br />
100


