

Measuring the Benefits of Intercity Passenger Rail: A Study
Measuring the Benefits of Intercity Passenger Rail: A Study
Measuring the Benefits of Intercity Passenger Rail: A Study

Create successful ePaper yourself
Turn your PDF publications into a flip-book with our unique Google optimized e-Paper software.
Comparing <strong>the</strong> total column in Table 5-2 with <strong>the</strong> percentage distribution <strong>of</strong> FFY 2009<br />
station activity reported in Table 3-4 indicates how <strong>the</strong> sample in this survey differs from <strong>the</strong><br />
actual passenger traffic levels. The distribution <strong>of</strong> passenger boardings and alightings from both<br />
survey periods was approximately equal to <strong>the</strong> distribution <strong>of</strong> passenger activity in FFY 2009,<br />
with a deviation <strong>of</strong> three percentage points or less. <strong>Passenger</strong> activity at Ardmore was overrepresented<br />
in <strong>the</strong> sample in April while activity in Norman and Fort Worth was overrepresented<br />
in July. <strong>Passenger</strong> activity at Pauls Valley was under-represented in April while<br />
Ardmore and Gainesville were under-represented in July.<br />
Travel Mode To/From <strong>Rail</strong> Station<br />
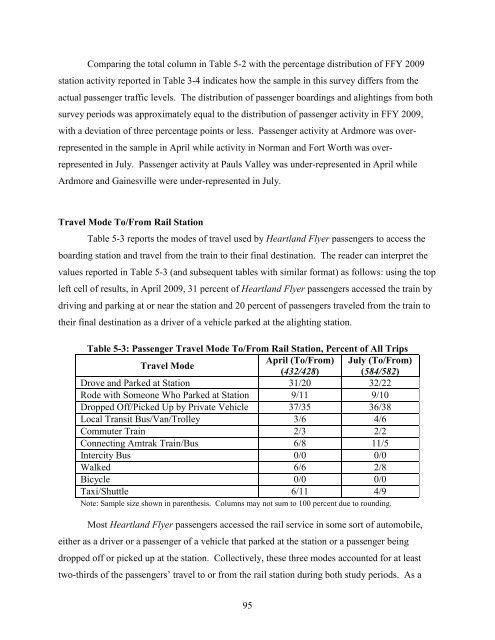
Table 5-3 reports <strong>the</strong> modes <strong>of</strong> travel used by Heartland Flyer passengers to access <strong>the</strong><br />
boarding station and travel from <strong>the</strong> train to <strong>the</strong>ir final destination. The reader can interpret <strong>the</strong><br />
values reported in Table 5-3 (and subsequent tables with similar format) as follows: using <strong>the</strong> top<br />
left cell <strong>of</strong> results, in April 2009, 31 percent <strong>of</strong> Heartland Flyer passengers accessed <strong>the</strong> train by<br />
driving and parking at or near <strong>the</strong> station and 20 percent <strong>of</strong> passengers traveled from <strong>the</strong> train to<br />
<strong>the</strong>ir final destination as a driver <strong>of</strong> a vehicle parked at <strong>the</strong> alighting station.<br />
Table 5-3: <strong>Passenger</strong> Travel Mode To/From <strong>Rail</strong> Station, Percent <strong>of</strong> All Trips<br />
Travel Mode<br />
April (To/From)<br />
(432/428)<br />
July (To/From)<br />
(584/582)<br />
Drove and Parked at Station 31/20 32/22<br />
Rode with Someone Who Parked at Station 9/11 9/10<br />
Dropped Off/Picked Up by Private Vehicle 37/35 36/38<br />
Local Transit Bus/Van/Trolley 3/6 4/6<br />
Commuter Train 2/3 2/2<br />
Connecting Amtrak Train/Bus 6/8 11/5<br />
<strong>Intercity</strong> Bus 0/0 0/0<br />
Walked 6/6 2/8<br />
Bicycle 0/0 0/0<br />
Taxi/Shuttle 6/11 4/9<br />
Note: Sample size shown in paren<strong>the</strong>sis. Columns may not sum to 100 percent due to rounding.<br />
Most Heartland Flyer passengers accessed <strong>the</strong> rail service in some sort <strong>of</strong> automobile,<br />
ei<strong>the</strong>r as a driver or a passenger <strong>of</strong> a vehicle that parked at <strong>the</strong> station or a passenger being<br />
dropped <strong>of</strong>f or picked up at <strong>the</strong> station. Collectively, <strong>the</strong>se three modes accounted for at least<br />
two-thirds <strong>of</strong> <strong>the</strong> passengers’ travel to or from <strong>the</strong> rail station during both study periods. As a<br />
95


