

Measuring the Benefits of Intercity Passenger Rail: A Study
Measuring the Benefits of Intercity Passenger Rail: A Study
Measuring the Benefits of Intercity Passenger Rail: A Study

Create successful ePaper yourself
Turn your PDF publications into a flip-book with our unique Google optimized e-Paper software.
travel mode from <strong>the</strong> alighting station to <strong>the</strong> passenger’s final destination, taxi or o<strong>the</strong>r type <strong>of</strong><br />
shuttle service also captured a substantial proportion <strong>of</strong> trips. Non-motorized travel modes<br />
accounted for a relatively small share <strong>of</strong> <strong>the</strong>se trips. Figures also show that for most travel<br />
modes, <strong>the</strong> split between access mode to <strong>the</strong> station and egress mode to <strong>the</strong> final destination did<br />
not vary between April and July. A substantially higher percentage <strong>of</strong> travelers accessed <strong>the</strong><br />
Heartland Flyer via a connecting Amtrak service in July than in April, possibly reflecting<br />
longer-distance vacations or o<strong>the</strong>r travel during <strong>the</strong> peak season.<br />
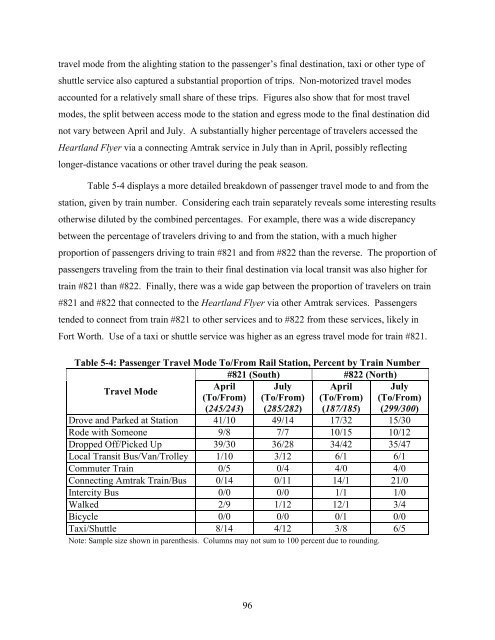
Table 5-4 displays a more detailed breakdown <strong>of</strong> passenger travel mode to and from <strong>the</strong><br />
station, given by train number. Considering each train separately reveals some interesting results<br />
o<strong>the</strong>rwise diluted by <strong>the</strong> combined percentages. For example, <strong>the</strong>re was a wide discrepancy<br />
between <strong>the</strong> percentage <strong>of</strong> travelers driving to and from <strong>the</strong> station, with a much higher<br />
proportion <strong>of</strong> passengers driving to train #821 and from #822 than <strong>the</strong> reverse. The proportion <strong>of</strong><br />
passengers traveling from <strong>the</strong> train to <strong>the</strong>ir final destination via local transit was also higher for<br />
train #821 than #822. Finally, <strong>the</strong>re was a wide gap between <strong>the</strong> proportion <strong>of</strong> travelers on train<br />
#821 and #822 that connected to <strong>the</strong> Heartland Flyer via o<strong>the</strong>r Amtrak services. <strong>Passenger</strong>s<br />
tended to connect from train #821 to o<strong>the</strong>r services and to #822 from <strong>the</strong>se services, likely in<br />
Fort Worth. Use <strong>of</strong> a taxi or shuttle service was higher as an egress travel mode for train #821.<br />
Table 5-4: <strong>Passenger</strong> Travel Mode To/From <strong>Rail</strong> Station, Percent by Train Number<br />
#821 (South) #822 (North)<br />
Travel Mode<br />
April<br />
(To/From)<br />
July<br />
(To/From)<br />
April<br />
(To/From)<br />
July<br />
(To/From)<br />
(245/243) (285/282) (187/185) (299/300)<br />
Drove and Parked at Station 41/10 49/14 17/32 15/30<br />
Rode with Someone 9/8 7/7 10/15 10/12<br />
Dropped Off/Picked Up 39/30 36/28 34/42 35/47<br />
Local Transit Bus/Van/Trolley 1/10 3/12 6/1 6/1<br />
Commuter Train 0/5 0/4 4/0 4/0<br />
Connecting Amtrak Train/Bus 0/14 0/11 14/1 21/0<br />
<strong>Intercity</strong> Bus 0/0 0/0 1/1 1/0<br />
Walked 2/9 1/12 12/1 3/4<br />
Bicycle 0/0 0/0 0/1 0/0<br />
Taxi/Shuttle 8/14 4/12 3/8 6/5<br />
Note: Sample size shown in paren<strong>the</strong>sis. Columns may not sum to 100 percent due to rounding.<br />
96


