

Measuring the Benefits of Intercity Passenger Rail: A Study
Measuring the Benefits of Intercity Passenger Rail: A Study
Measuring the Benefits of Intercity Passenger Rail: A Study

You also want an ePaper? Increase the reach of your titles
YUMPU automatically turns print PDFs into web optimized ePapers that Google loves.
across Thursday, Friday, and Saturday all returning on Sundays. Among Monday, Tuesday, and<br />
Wednesday, <strong>the</strong>re appears to be very little difference between ridership on <strong>the</strong> two train runs.<br />
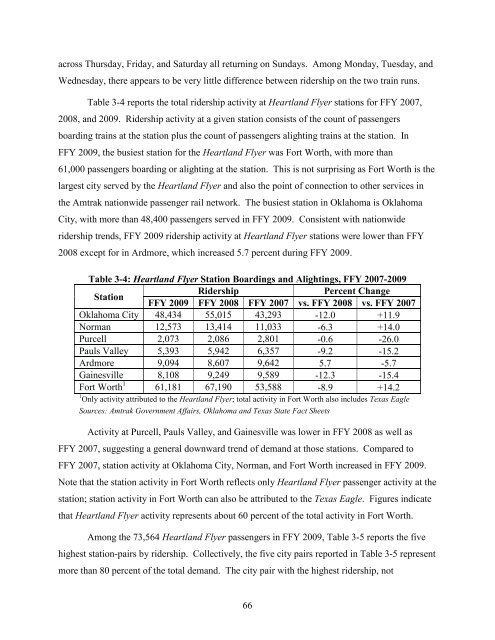
Table 3-4 reports <strong>the</strong> total ridership activity at Heartland Flyer stations for FFY 2007,<br />
2008, and 2009. Ridership activity at a given station consists <strong>of</strong> <strong>the</strong> count <strong>of</strong> passengers<br />
boarding trains at <strong>the</strong> station plus <strong>the</strong> count <strong>of</strong> passengers alighting trains at <strong>the</strong> station. In<br />
FFY 2009, <strong>the</strong> busiest station for <strong>the</strong> Heartland Flyer was Fort Worth, with more than<br />
61,000 passengers boarding or alighting at <strong>the</strong> station. This is not surprising as Fort Worth is <strong>the</strong><br />
largest city served by <strong>the</strong> Heartland Flyer and also <strong>the</strong> point <strong>of</strong> connection to o<strong>the</strong>r services in<br />
<strong>the</strong> Amtrak nationwide passenger rail network. The busiest station in Oklahoma is Oklahoma<br />
City, with more than 48,400 passengers served in FFY 2009. Consistent with nationwide<br />
ridership trends, FFY 2009 ridership activity at Heartland Flyer stations were lower than FFY<br />
2008 except for in Ardmore, which increased 5.7 percent during FFY 2009.<br />
Table 3-4: Heartland Flyer Station Boardings and Alightings, FFY 2007-2009<br />
Station<br />
Ridership Percent Change<br />
FFY 2009 FFY 2008 FFY 2007 vs. FFY 2008 vs. FFY 2007<br />
Oklahoma City 48,434 55,015 43,293 -12.0 +11.9<br />
Norman 12,573 13,414 11,033 -6.3 +14.0<br />
Purcell 2,073 2,086 2,801 -0.6 -26.0<br />
Pauls Valley 5,393 5,942 6,357 -9.2 -15.2<br />
Ardmore 9,094 8,607 9,642 5.7 -5.7<br />
Gainesville 8,108 9,249 9,589 -12.3 -15.4<br />
Fort Worth 1 61,181 67,190 53,588 -8.9 +14.2<br />
1 Only activity attributed to <strong>the</strong> Heartland Flyer; total activity in Fort Worth also includes Texas Eagle<br />
Sources: Amtrak Government Affairs, Oklahoma and Texas State Fact Sheets<br />
Activity at Purcell, Pauls Valley, and Gainesville was lower in FFY 2008 as well as<br />
FFY 2007, suggesting a general downward trend <strong>of</strong> demand at those stations. Compared to<br />
FFY 2007, station activity at Oklahoma City, Norman, and Fort Worth increased in FFY 2009.<br />
Note that <strong>the</strong> station activity in Fort Worth reflects only Heartland Flyer passenger activity at <strong>the</strong><br />
station; station activity in Fort Worth can also be attributed to <strong>the</strong> Texas Eagle. Figures indicate<br />
that Heartland Flyer activity represents about 60 percent <strong>of</strong> <strong>the</strong> total activity in Fort Worth.<br />
Among <strong>the</strong> 73,564 Heartland Flyer passengers in FFY 2009, Table 3-5 reports <strong>the</strong> five<br />
highest station-pairs by ridership. Collectively, <strong>the</strong> five city pairs reported in Table 3-5 represent<br />
more than 80 percent <strong>of</strong> <strong>the</strong> total demand. The city pair with <strong>the</strong> highest ridership, not<br />
66


