Measuring the Benefits of Intercity Passenger Rail: A Study
Measuring the Benefits of Intercity Passenger Rail: A Study
Measuring the Benefits of Intercity Passenger Rail: A Study
You also want an ePaper? Increase the reach of your titles
YUMPU automatically turns print PDFs into web optimized ePapers that Google loves.
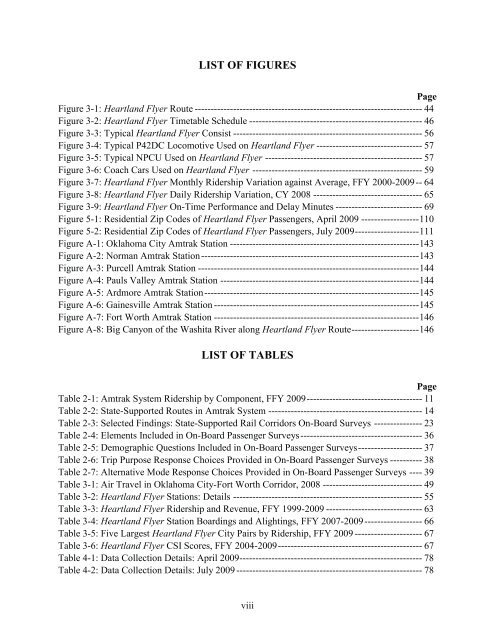
LIST OF FIGURES<br />
Page<br />
Figure 3-1: Heartland Flyer Route ----------------------------------------------------------------------- 44<br />
Figure 3-2: Heartland Flyer Timetable Schedule ------------------------------------------------------ 46<br />
Figure 3-3: Typical Heartland Flyer Consist ----------------------------------------------------------- 56<br />
Figure 3-4: Typical P42DC Locomotive Used on Heartland Flyer --------------------------------- 57<br />
Figure 3-5: Typical NPCU Used on Heartland Flyer ------------------------------------------------- 57<br />
Figure 3-6: Coach Cars Used on Heartland Flyer ----------------------------------------------------- 59<br />
Figure 3-7: Heartland Flyer Monthly Ridership Variation against Average, FFY 2000-2009 -- 64<br />
Figure 3-8: Heartland Flyer Daily Ridership Variation, CY 2008 ---------------------------------- 65<br />
Figure 3-9: Heartland Flyer On-Time Performance and Delay Minutes --------------------------- 69<br />
Figure 5-1: Residential Zip Codes <strong>of</strong> Heartland Flyer <strong>Passenger</strong>s, April 2009 ------------------ 110<br />
Figure 5-2: Residential Zip Codes <strong>of</strong> Heartland Flyer <strong>Passenger</strong>s, July 2009 -------------------- 111<br />
Figure A-1: Oklahoma City Amtrak Station ----------------------------------------------------------- 143<br />
Figure A-2: Norman Amtrak Station -------------------------------------------------------------------- 143<br />
Figure A-3: Purcell Amtrak Station --------------------------------------------------------------------- 144<br />
Figure A-4: Pauls Valley Amtrak Station -------------------------------------------------------------- 144<br />
Figure A-5: Ardmore Amtrak Station ------------------------------------------------------------------- 145<br />
Figure A-6: Gainesville Amtrak Station ---------------------------------------------------------------- 145<br />
Figure A-7: Fort Worth Amtrak Station ---------------------------------------------------------------- 146<br />
Figure A-8: Big Canyon <strong>of</strong> <strong>the</strong> Washita River along Heartland Flyer Route --------------------- 146<br />
LIST OF TABLES<br />
Page<br />
Table 2-1: Amtrak System Ridership by Component, FFY 2009 ------------------------------------ 11<br />
Table 2-2: State-Supported Routes in Amtrak System ------------------------------------------------ 14<br />
Table 2-3: Selected Findings: State-Supported <strong>Rail</strong> Corridors On-Board Surveys --------------- 23<br />
Table 2-4: Elements Included in On-Board <strong>Passenger</strong> Surveys -------------------------------------- 36<br />
Table 2-5: Demographic Questions Included in On-Board <strong>Passenger</strong> Surveys -------------------- 37<br />
Table 2-6: Trip Purpose Response Choices Provided in On-Board <strong>Passenger</strong> Surveys ---------- 38<br />
Table 2-7: Alternative Mode Response Choices Provided in On-Board <strong>Passenger</strong> Surveys ---- 39<br />
Table 3-1: Air Travel in Oklahoma City-Fort Worth Corridor, 2008 ------------------------------- 49<br />
Table 3-2: Heartland Flyer Stations: Details ----------------------------------------------------------- 55<br />
Table 3-3: Heartland Flyer Ridership and Revenue, FFY 1999-2009 ------------------------------ 63<br />
Table 3-4: Heartland Flyer Station Boardings and Alightings, FFY 2007-2009 ------------------ 66<br />
Table 3-5: Five Largest Heartland Flyer City Pairs by Ridership, FFY 2009 --------------------- 67<br />
Table 3-6: Heartland Flyer CSI Scores, FFY 2004-2009 --------------------------------------------- 67<br />
Table 4-1: Data Collection Details: April 2009 --------------------------------------------------------- 78<br />
Table 4-2: Data Collection Details: July 2009 ---------------------------------------------------------- 78<br />
viii


