Measuring the Benefits of Intercity Passenger Rail: A Study
Measuring the Benefits of Intercity Passenger Rail: A Study
Measuring the Benefits of Intercity Passenger Rail: A Study
You also want an ePaper? Increase the reach of your titles
YUMPU automatically turns print PDFs into web optimized ePapers that Google loves.
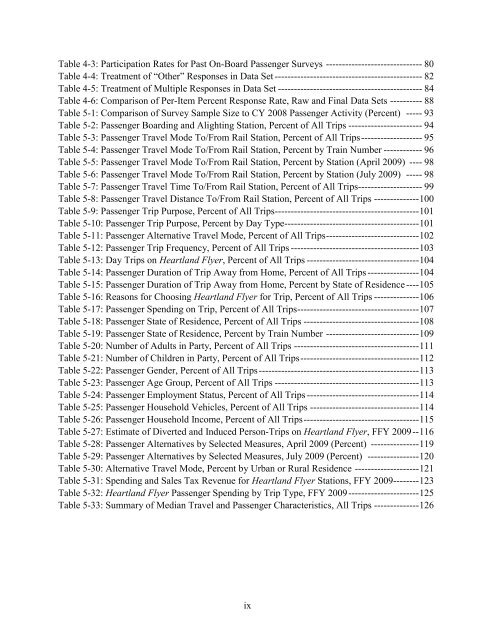
Table 4-3: Participation Rates for Past On-Board <strong>Passenger</strong> Surveys ------------------------------ 80<br />
Table 4-4: Treatment <strong>of</strong> “O<strong>the</strong>r” Responses in Data Set ---------------------------------------------- 82<br />
Table 4-5: Treatment <strong>of</strong> Multiple Responses in Data Set --------------------------------------------- 84<br />
Table 4-6: Comparison <strong>of</strong> Per-Item Percent Response Rate, Raw and Final Data Sets ---------- 88<br />
Table 5-1: Comparison <strong>of</strong> Survey Sample Size to CY 2008 <strong>Passenger</strong> Activity (Percent) ----- 93<br />
Table 5-2: <strong>Passenger</strong> Boarding and Alighting Station, Percent <strong>of</strong> All Trips ----------------------- 94<br />
Table 5-3: <strong>Passenger</strong> Travel Mode To/From <strong>Rail</strong> Station, Percent <strong>of</strong> All Trips ------------------- 95<br />
Table 5-4: <strong>Passenger</strong> Travel Mode To/From <strong>Rail</strong> Station, Percent by Train Number ------------ 96<br />
Table 5-5: <strong>Passenger</strong> Travel Mode To/From <strong>Rail</strong> Station, Percent by Station (April 2009) ---- 98<br />
Table 5-6: <strong>Passenger</strong> Travel Mode To/From <strong>Rail</strong> Station, Percent by Station (July 2009) ----- 98<br />
Table 5-7: <strong>Passenger</strong> Travel Time To/From <strong>Rail</strong> Station, Percent <strong>of</strong> All Trips-------------------- 99<br />
Table 5-8: <strong>Passenger</strong> Travel Distance To/From <strong>Rail</strong> Station, Percent <strong>of</strong> All Trips -------------- 100<br />
Table 5-9: <strong>Passenger</strong> Trip Purpose, Percent <strong>of</strong> All Trips --------------------------------------------- 101<br />
Table 5-10: <strong>Passenger</strong> Trip Purpose, Percent by Day Type------------------------------------------ 101<br />
Table 5-11: <strong>Passenger</strong> Alternative Travel Mode, Percent <strong>of</strong> All Trips ----------------------------- 102<br />
Table 5-12: <strong>Passenger</strong> Trip Frequency, Percent <strong>of</strong> All Trips ---------------------------------------- 103<br />
Table 5-13: Day Trips on Heartland Flyer, Percent <strong>of</strong> All Trips ----------------------------------- 104<br />
Table 5-14: <strong>Passenger</strong> Duration <strong>of</strong> Trip Away from Home, Percent <strong>of</strong> All Trips ---------------- 104<br />
Table 5-15: <strong>Passenger</strong> Duration <strong>of</strong> Trip Away from Home, Percent by State <strong>of</strong> Residence ---- 105<br />
Table 5-16: Reasons for Choosing Heartland Flyer for Trip, Percent <strong>of</strong> All Trips -------------- 106<br />
Table 5-17: <strong>Passenger</strong> Spending on Trip, Percent <strong>of</strong> All Trips -------------------------------------- 107<br />
Table 5-18: <strong>Passenger</strong> State <strong>of</strong> Residence, Percent <strong>of</strong> All Trips ------------------------------------ 108<br />
Table 5-19: <strong>Passenger</strong> State <strong>of</strong> Residence, Percent by Train Number ----------------------------- 109<br />
Table 5-20: Number <strong>of</strong> Adults in Party, Percent <strong>of</strong> All Trips --------------------------------------- 111<br />
Table 5-21: Number <strong>of</strong> Children in Party, Percent <strong>of</strong> All Trips ------------------------------------- 112<br />
Table 5-22: <strong>Passenger</strong> Gender, Percent <strong>of</strong> All Trips -------------------------------------------------- 113<br />
Table 5-23: <strong>Passenger</strong> Age Group, Percent <strong>of</strong> All Trips --------------------------------------------- 113<br />
Table 5-24: <strong>Passenger</strong> Employment Status, Percent <strong>of</strong> All Trips ----------------------------------- 114<br />
Table 5-25: <strong>Passenger</strong> Household Vehicles, Percent <strong>of</strong> All Trips ---------------------------------- 114<br />
Table 5-26: <strong>Passenger</strong> Household Income, Percent <strong>of</strong> All Trips ------------------------------------ 115<br />
Table 5-27: Estimate <strong>of</strong> Diverted and Induced Person-Trips on Heartland Flyer, FFY 2009 -- 116<br />
Table 5-28: <strong>Passenger</strong> Alternatives by Selected Measures, April 2009 (Percent) --------------- 119<br />
Table 5-29: <strong>Passenger</strong> Alternatives by Selected Measures, July 2009 (Percent) ---------------- 120<br />
Table 5-30: Alternative Travel Mode, Percent by Urban or Rural Residence -------------------- 121<br />
Table 5-31: Spending and Sales Tax Revenue for Heartland Flyer Stations, FFY 2009-------- 123<br />
Table 5-32: Heartland Flyer <strong>Passenger</strong> Spending by Trip Type, FFY 2009 ---------------------- 125<br />
Table 5-33: Summary <strong>of</strong> Median Travel and <strong>Passenger</strong> Characteristics, All Trips -------------- 126<br />
ix


