

Tamil Nadu Urban Infrastructure Financial Services ... - Municipal
Tamil Nadu Urban Infrastructure Financial Services ... - Municipal
Tamil Nadu Urban Infrastructure Financial Services ... - Municipal

Create successful ePaper yourself
Turn your PDF publications into a flip-book with our unique Google optimized e-Paper software.
11 Waste generation per capita (gms) 414 Composing, Source segregation and Door-to-<br />
12 Collection efficiency (% of waste<br />
generated)<br />
14 Compost yard area (Acres per 10,000<br />
population)<br />
100%<br />
74%<br />
15 Average vehicle trips 4<br />
16 Source Segregation and Composting<br />
(Yes/No)<br />
Analysis of financial performance<br />
partial<br />
door collection needs implementation in a<br />
phased manner.<br />
Awareness among citizens for less usage of<br />
plastics.<br />
Scope for greater private participation<br />
covering end-to-end given the size and scope<br />
of the SWM service requirement.<br />
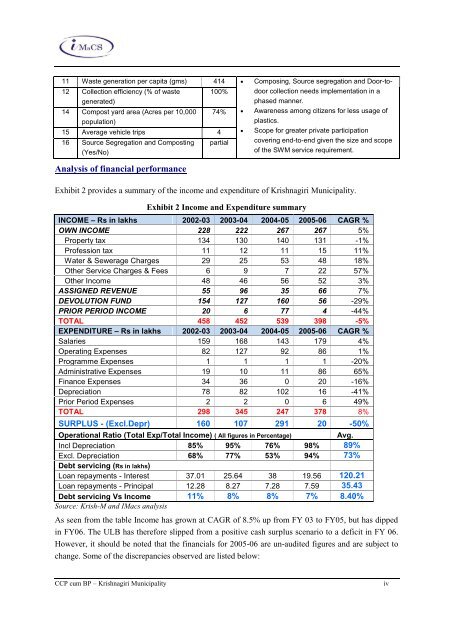
Exhibit 2 provides a summary of the income and expenditure of Krishnagiri <strong>Municipal</strong>ity.<br />
Exhibit 2 Income and Expenditure summary<br />
INCOME – Rs in lakhs 2002-03 2003-04 2004-05 2005-06 CAGR %<br />
OWN INCOME 228 222 267 267 5%<br />
Property tax 134 130 140 131 -1%<br />
Profession tax 11 12 11 15 11%<br />
Water & Sewerage Charges 29 25 53 48 18%<br />
Other Service Charges & Fees 6 9 7 22 57%<br />
Other Income 48 46 56 52 3%<br />
ASSIGNED REVENUE 55 96 35 66 7%<br />
DEVOLUTION FUND 154 127 160 56 -29%<br />
PRIOR PERIOD INCOME 20 6 77 4 -44%<br />
TOTAL 458 452 539 398 -5%<br />
EXPENDITURE – Rs in lakhs 2002-03 2003-04 2004-05 2005-06 CAGR %<br />
Salaries 159 168 143 179 4%<br />
Operating Expenses 82 127 92 86 1%<br />
Programme Expenses 1 1 1 1 -20%<br />
Administrative Expenses 19 10 11 86 65%<br />
Finance Expenses 34 36 0 20 -16%<br />
Depreciation 78 82 102 16 -41%<br />
Prior Period Expenses 2 2 0 6 49%<br />
TOTAL 298 345 247 378 8%<br />
SURPLUS - (Excl.Depr) 160 107 291 20 -50%<br />
Operational Ratio (Total Exp/Total Income) ( All figures in Percentage) Avg.<br />
Incl Depreciation 85% 95% 76% 98% 89%<br />
Excl. Depreciation 68% 77% 53% 94% 73%<br />
Debt servicing (Rs in lakhs)<br />
Loan repayments - Interest 37.01 25.64 38 19.56 120.21<br />
Loan repayments - Principal 12.28 8.27 7.28 7.59 35.43<br />
Debt servicing Vs Income 11% 8% 8% 7% 8.40%<br />
Source: Krish-M and IMacs analysis<br />
As seen from the table Income has grown at CAGR of 8.5% up from FY 03 to FY05, but has dipped<br />
in FY06. The ULB has therefore slipped from a positive cash surplus scenario to a deficit in FY 06.<br />
However, it should be noted that the financials for 2005-06 are un-audited figures and are subject to<br />
change. Some of the discrepancies observed are listed below:<br />
CCP cum BP – Krishnagiri <strong>Municipal</strong>ity iv


