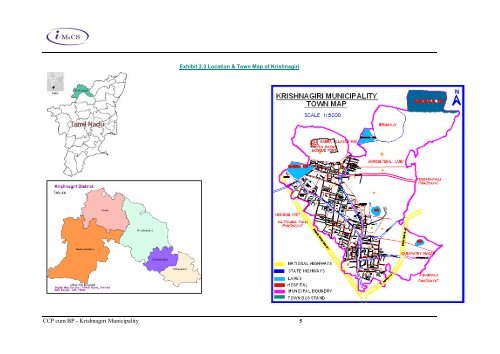
Exhibit 2.3 Location & Town Map of Krishnagiri CCP cum BP - Krishnagiri <strong>Municipal</strong>ity 5
2.3.2 Ward wise population Population is largely concentrated in central parts of the town. Exhibit 2.4 provides the ward wise population of the town as per Census 2001. Exhibit 2.4 Ward wise Details Total Ward no Households population Males Females Sex ratio 1 339 1,719 903 816 904 2 295 1,549 771 778 1,009 3 352 1,876 912 964 1,057 4 323 1,544 787 757 962 5 273 1,421 704 717 1,018 6 277 1,361 702 659 939 7 379 1,849 937 912 973 8 400 1,885 917 968 1,056 9 316 1,693 835 858 1,028 10 486 2,377 1,219 1,158 950 11 336 1,519 733 786 1,072 12 423 1,981 988 993 1,005 13 369 1,694 847 847 1,000 14 371 1,652 803 849 1,057 15 471 2,089 1,078 1,011 938 16 449 2,170 1,093 1,077 985 17 370 1,835 904 931 1,030 18 254 1,353 730 623 853 19 307 1,388 694 694 1,000 20 152 643 329 314 954 21 637 3,119 1,534 1,585 1,033 22 504 2,470 1,253 1,217 971 23 432 1,892 934 958 1,026 24 312 1,532 799 733 917 25 509 2,353 1,203 1,150 956 26 486 2,629 1,379 1,250 906 27 462 2,072 1,051 1,021 971 28 612 3,012 1,573 1,439 915 29 320 1,451 721 730 1,012 30 372 1,673 795 878 1,104 31 587 2,507 1,249 1,258 1,007 32 504 2,301 1,124 1,177 1,047 33 818 3,978 1,991 1,987 998 TOTAL 13,497 64,587 32,492 32,095 988 CCP cum BP - Krishnagiri <strong>Municipal</strong>ity 6