Tamil Nadu Urban Infrastructure Financial Services ... - Municipal
Tamil Nadu Urban Infrastructure Financial Services ... - Municipal
Tamil Nadu Urban Infrastructure Financial Services ... - Municipal
You also want an ePaper? Increase the reach of your titles
YUMPU automatically turns print PDFs into web optimized ePapers that Google loves.
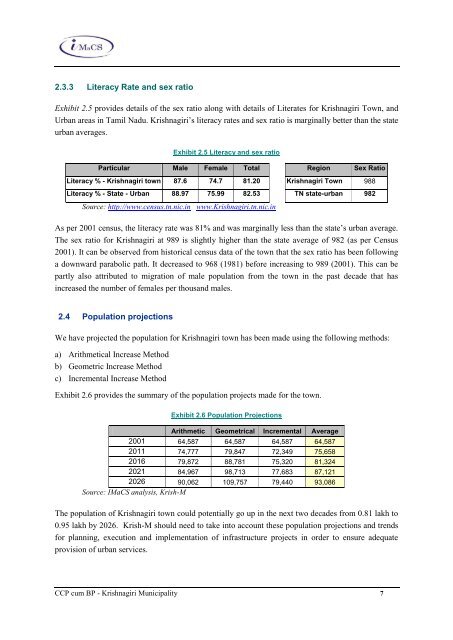
2.3.3 Literacy Rate and sex ratio<br />
Exhibit 2.5 provides details of the sex ratio along with details of Literates for Krishnagiri Town, and<br />
<strong>Urban</strong> areas in <strong>Tamil</strong> <strong>Nadu</strong>. Krishnagiri‟s literacy rates and sex ratio is marginally better than the state<br />
urban averages.<br />
Exhibit 2.5 Literacy and sex ratio<br />
Particular Male Female Total Region Sex Ratio<br />
Literacy % - Krishnagiri town 87.6 74.7 81.20 Krishnagiri Town 988<br />
Literacy % - State - <strong>Urban</strong> 88.97 75.99 82.53 TN state-urban 982<br />
Source: http://www.census.tn.nic.in www.Krishnagiri.tn.nic.in<br />
As per 2001 census, the literacy rate was 81% and was marginally less than the state‟s urban average.<br />
The sex ratio for Krishnagiri at 989 is slightly higher than the state average of 982 (as per Census<br />
2001). It can be observed from historical census data of the town that the sex ratio has been following<br />
a downward parabolic path. It decreased to 968 (1981) before increasing to 989 (2001). This can be<br />
partly also attributed to migration of male population from the town in the past decade that has<br />
increased the number of females per thousand males.<br />
2.4 Population projections<br />
We have projected the population for Krishnagiri town has been made using the following methods:<br />
a) Arithmetical Increase Method<br />
b) Geometric Increase Method<br />
c) Incremental Increase Method<br />
Exhibit 2.6 provides the summary of the population projects made for the town.<br />
Exhibit 2.6 Population Projections<br />
Arithmetic Geometrical Incremental Average<br />
2001 64,587 64,587 64,587 64,587<br />
2011 74,777 79,847 72,349 75,658<br />
2016 79,872 88,781 75,320 81,324<br />
2021 84,967 98,713 77,683 87,121<br />
2026 90,062 109,757 79,440 93,086<br />
Source: IMaCS analysis, Krish-M<br />
The population of Krishnagiri town could potentially go up in the next two decades from 0.81 lakh to<br />
0.95 lakh by 2026. Krish-M should need to take into account these population projections and trends<br />
for planning, execution and implementation of infrastructure projects in order to ensure adequate<br />
provision of urban services.<br />
CCP cum BP - Krishnagiri <strong>Municipal</strong>ity 7


