

Tamil Nadu Urban Infrastructure Financial Services ... - Municipal
Tamil Nadu Urban Infrastructure Financial Services ... - Municipal
Tamil Nadu Urban Infrastructure Financial Services ... - Municipal

Create successful ePaper yourself
Turn your PDF publications into a flip-book with our unique Google optimized e-Paper software.
a) No. of connections - Connections have increased from 4479 in FY 2003 to 6642 in FY 2007<br />
b) Water tariff / connection has increase from Rs. 553 in FY 03 to Rs. 636 in FY 07.<br />
c) Collection efficiency - Current collection efficiencies have decreased from 75 % (FY 2004)<br />
to 56 % (FY 2007). Arrears collection efficiency has been less than 50% and it has declined<br />
from 48% (FY 04) to 43 % (FY 07). The overall collection efficiency of 67 % (FY 04) has<br />
now been 51% (FY 07), which is quite low and needs significant improvement.<br />
6.3.6 Assigned Revenue<br />
Assigned Revenue (which includes transfers of stamp duty<br />
and entertainment tax) sows inconsistent trend over the<br />
four-year period with sudden increase to Rs.96 lakh (FY<br />
04) from Rs.55 lakh (FY 03); then declined to nearly Rs<br />
35.4 lakh in FY2005 and again increased to Rs. 66.4 lakh<br />
(FY 06). Share of assigned revenue in total income<br />
declined from 12% of revenue in FY 03 to 7% of revenue<br />
in FY 05 to again increase to 18% in FY 06.<br />
6.3.7 Devolution Fund<br />
Devolution fund also shows inconsistent trend with<br />
revenue of Rs. 154.24 lakh (FY 03) decreasing to<br />
Rs.126.89 lakh (FY 04), which was further increased in<br />
FY 05 and to again decrease substantially to Rs. 55.56<br />
lakh (FY 06). Share of this fund in total revenue of the<br />
municipality has declined from 34% to 15% in respective<br />
years.<br />
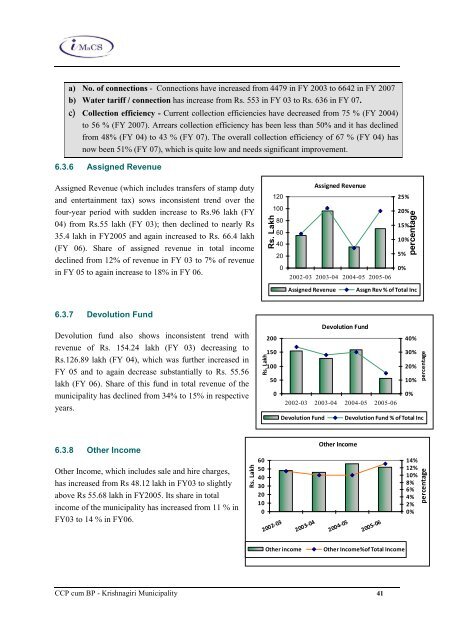
6.3.8 Other Income<br />
Other Income, which includes sale and hire charges,<br />
has increased from Rs 48.12 lakh in FY03 to slightly<br />
above Rs 55.68 lakh in FY2005. Its share in total<br />
income of the municipality has increased from 11 % in<br />
FY03 to 14 % in FY06.<br />
Other Income<br />
CCP cum BP - Krishnagiri <strong>Municipal</strong>ity 41<br />
Rs. Lakh<br />
Rs. Lakh<br />
60<br />
50<br />
40<br />
30<br />
20<br />
10<br />
0<br />
Rs. Lakh<br />
200<br />
150<br />
100<br />
120<br />
100<br />
50<br />
0<br />
80<br />
60<br />
40<br />
20<br />
0<br />
2002-03<br />
2003-04<br />
Assigned Revenue<br />
2002-03 2003-04 2004-05 2005-06<br />
2004-05<br />
2005-06<br />
Other income Other Income%of Total Income<br />
25%<br />
20%<br />
15%<br />
10%<br />
5%<br />
0%<br />
Assigned Revenue Assgn Rev % of Total Inc<br />
Devolution Fund<br />
2002-03 2003-04 2004-05 2005-06<br />
percentage<br />
40%<br />
30%<br />
20%<br />
10%<br />
0%<br />
Devolution Fund Devolution Fund % of Total Inc<br />
14%<br />
12%<br />
10%<br />
8%<br />
6%<br />
4%<br />
2%<br />
0%<br />
percentage<br />
percentage


