

Tamil Nadu Urban Infrastructure Financial Services ... - Municipal
Tamil Nadu Urban Infrastructure Financial Services ... - Municipal
Tamil Nadu Urban Infrastructure Financial Services ... - Municipal

You also want an ePaper? Increase the reach of your titles
YUMPU automatically turns print PDFs into web optimized ePapers that Google loves.
6. Analysis of financials<br />
This section provides a summary analysis of the financial performance of Krishnagiri <strong>Municipal</strong>ity.<br />
6.1 Income and Expenditure summary of Krishnagiri <strong>Municipal</strong>ity<br />
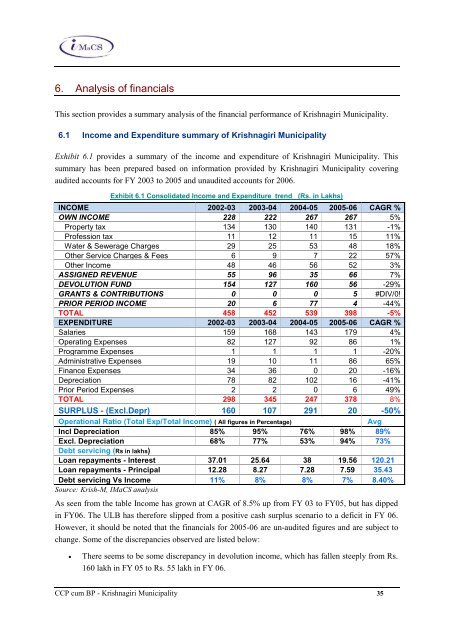
Exhibit 6.1 provides a summary of the income and expenditure of Krishnagiri <strong>Municipal</strong>ity. This<br />
summary has been prepared based on information provided by Krishnagiri <strong>Municipal</strong>ity covering<br />
audited accounts for FY 2003 to 2005 and unaudited accounts for 2006.<br />
Exhibit 6.1 Consolidated Income and Expenditure trend (Rs. in Lakhs)<br />
INCOME 2002-03 2003-04 2004-05 2005-06 CAGR %<br />
OWN INCOME 228 222 267 267 5%<br />
Property tax 134 130 140 131 -1%<br />
Profession tax 11 12 11 15 11%<br />
Water & Sewerage Charges 29 25 53 48 18%<br />
Other Service Charges & Fees 6 9 7 22 57%<br />
Other Income 48 46 56 52 3%<br />
ASSIGNED REVENUE 55 96 35 66 7%<br />
DEVOLUTION FUND 154 127 160 56 -29%<br />
GRANTS & CONTRIBUTIONS 0 0 0 5 #DIV/0!<br />
PRIOR PERIOD INCOME 20 6 77 4 -44%<br />
TOTAL 458 452 539 398 -5%<br />
EXPENDITURE 2002-03 2003-04 2004-05 2005-06 CAGR %<br />
Salaries 159 168 143 179 4%<br />
Operating Expenses 82 127 92 86 1%<br />
Programme Expenses 1 1 1 1 -20%<br />
Administrative Expenses 19 10 11 86 65%<br />
Finance Expenses 34 36 0 20 -16%<br />
Depreciation 78 82 102 16 -41%<br />
Prior Period Expenses 2 2 0 6 49%<br />
TOTAL 298 345 247 378 8%<br />
SURPLUS - (Excl.Depr) 160 107 291 20 -50%<br />
Operational Ratio (Total Exp/Total Income) ( All figures in Percentage) Avg<br />
Incl Depreciation 85% 95% 76% 98% 89%<br />
Excl. Depreciation 68% 77% 53% 94% 73%<br />
Debt servicing (Rs in lakhs)<br />
Loan repayments - Interest 37.01 25.64 38 19.56 120.21<br />
Loan repayments - Principal 12.28 8.27 7.28 7.59 35.43<br />
Debt servicing Vs Income 11% 8% 8% 7% 8.40%<br />
Source: Krish-M, IMaCS analysis<br />
As seen from the table Income has grown at CAGR of 8.5% up from FY 03 to FY05, but has dipped<br />
in FY06. The ULB has therefore slipped from a positive cash surplus scenario to a deficit in FY 06.<br />
However, it should be noted that the financials for 2005-06 are un-audited figures and are subject to<br />
change. Some of the discrepancies observed are listed below:<br />
There seems to be some discrepancy in devolution income, which has fallen steeply from Rs.<br />
160 lakh in FY 05 to Rs. 55 lakh in FY 06.<br />
CCP cum BP - Krishnagiri <strong>Municipal</strong>ity 35


