

Tamil Nadu Urban Infrastructure Financial Services ... - Municipal
Tamil Nadu Urban Infrastructure Financial Services ... - Municipal
Tamil Nadu Urban Infrastructure Financial Services ... - Municipal

Create successful ePaper yourself
Turn your PDF publications into a flip-book with our unique Google optimized e-Paper software.
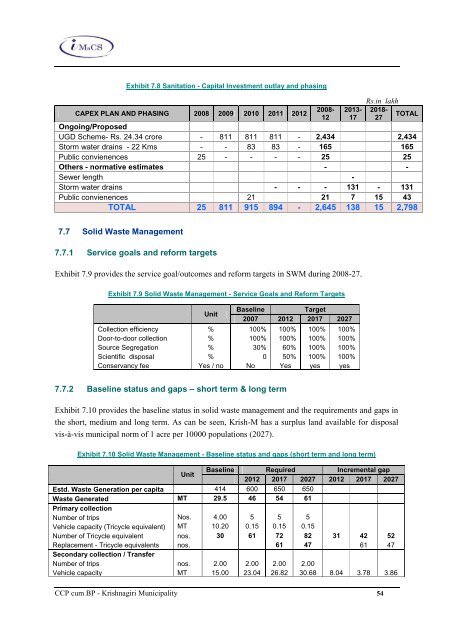
Exhibit 7.8 Sanitation - Capital Investment outlay and phasing<br />
Rs.in lakh<br />
CAPEX PLAN AND PHASING<br />
Ongoing/Proposed<br />
2008 2009 2010 2011 2012<br />
2008-<br />
12<br />
2013-<br />
17<br />
2018-<br />
27<br />
TOTAL<br />
UGD Scheme- Rs. 24.34 crore - 811 811 811 - 2,434<br />
2,434<br />
Storm water drains - 22 Kms - - 83 83 - 165<br />
165<br />
Public convienences 25 - - - - 25<br />
25<br />
Others - normative estimates<br />
-<br />
-<br />
Sewer length<br />
-<br />
Storm water drains<br />
- - - 131 - 131<br />
Public convienences<br />
21<br />
21 7 15 43<br />
TOTAL 25 811 915 894 - 2,645 138 15 2,798<br />
7.7 Solid Waste Management<br />
7.7.1 Service goals and reform targets<br />
Exhibit 7.9 provides the service goal/outcomes and reform targets in SWM during 2008-27.<br />
Exhibit 7.9 Solid Waste Management - Service Goals and Reform Targets<br />
Unit<br />
Baseline Target<br />
2007 2012 2017 2027<br />
Collection efficiency % 100% 100% 100% 100%<br />
Door-to-door collection % 100% 100% 100% 100%<br />
Source Segregation % 30% 60% 100% 100%<br />
Scientific disposal % 0 50% 100% 100%<br />
Conservancy fee Yes / no No Yes yes yes<br />
7.7.2 Baseline status and gaps – short term & long term<br />
Exhibit 7.10 provides the baseline status in solid waste management and the requirements and gaps in<br />
the short, medium and long term. As can be seen, Krish-M has a surplus land available for disposal<br />
vis-à-vis municipal norm of 1 acre per 10000 populations (2027).<br />
Exhibit 7.10 Solid Waste Management - Baseline status and gaps (short term and long term)<br />
Unit<br />
Baseline<br />
2012<br />
Required<br />
2017 2027<br />
Incremental gap<br />
2012 2017 2027<br />
Estd. Waste Generation per capita<br />
414 600 650 650<br />
Waste Generated<br />
Primary collection<br />
MT 29.5 46 54 61<br />
Number of trips Nos. 4.00 5 5 5<br />
Vehicle capacity (Tricycle equivalent) MT 10.20 0.15 0.15 0.15<br />
Number of Tricycle equivalent nos. 30 61 72 82 31 42 52<br />
Replacement - Tricycle equivalents<br />
Secondary collection / Transfer<br />
nos.<br />
61 47<br />
61 47<br />
Number of trips nos. 2.00 2.00 2.00 2.00<br />
Vehicle capacity MT 15.00 23.04 26.82 30.68 8.04 3.78 3.86<br />
CCP cum BP - Krishnagiri <strong>Municipal</strong>ity 54


