

General household survey - Statistics South Africa
General household survey - Statistics South Africa
General household survey - Statistics South Africa

Create successful ePaper yourself
Turn your PDF publications into a flip-book with our unique Google optimized e-Paper software.
<strong>Statistics</strong> <strong>South</strong> <strong>Africa</strong> 91<br />
P0318<br />
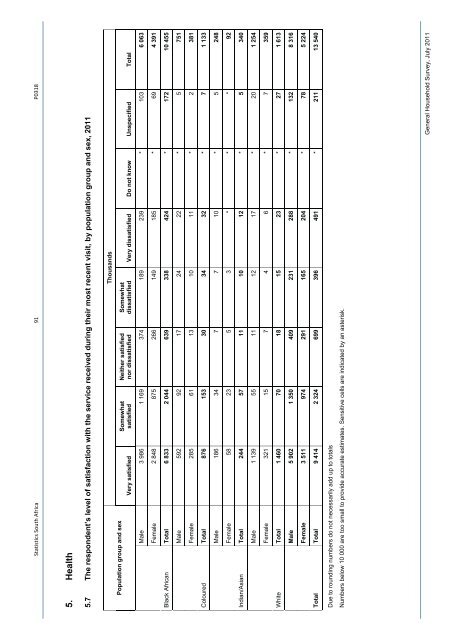
5. Health<br />
5.7 The respondent’s level of satisfaction with the service received during their most recent visit, by population group and sex, 2011<br />
Thousands<br />
Somewhat<br />
dissatisfied Very dissatisfied Do not know Unspecified Total<br />
Neither satisfied<br />
nor dissatisfied<br />
Somewhat<br />
satisfied<br />
Population group and sex<br />
Very satisfied<br />
Male 3 986 1 169 374 189 239 * 103 6 063<br />
Female 2 848 875 266 149 185 * 69 4 391<br />
Total 6 833 2 044 639 338 424 * 172 10 455<br />
Black <strong>Africa</strong>n<br />
Male 592 92 17 24 22 * 5 751<br />
Female 285 61 13 10 11 * 2 381<br />
Total 876 153 30 34 32 * 7 1 133<br />
Coloured<br />
Male 186 34 7 7 10 * 5 248<br />
Female 58 23 5 3 * * * 92<br />
Total 244 57 11 10 12 * 5 340<br />
Indian/Asian<br />
Male 1 139 55 11 12 17 * 20 1 254<br />
Female 321 15 7 4 6 * 7 359<br />
Total 1 460 70 18 15 23 * 27 1 613<br />
White<br />
Male 5 902 1 350 409 231 288 * 132 8 316<br />
Female 3 511 974 291 165 204 * 78 5 224<br />
Total 9 414 2 324 699 396 491 * 211 13 540<br />
Total<br />
Due to rounding numbers do not necessarily add up to totals<br />
Numbers below 10 000 are too small to provide accurate estimates. Sensitive cells are indicated by an asterisk.<br />
<strong>General</strong> Household Survey, July 2011


