

General household survey - Statistics South Africa
General household survey - Statistics South Africa
General household survey - Statistics South Africa

Create successful ePaper yourself
Turn your PDF publications into a flip-book with our unique Google optimized e-Paper software.
<strong>Statistics</strong> <strong>South</strong> <strong>Africa</strong> 119<br />
P0318<br />
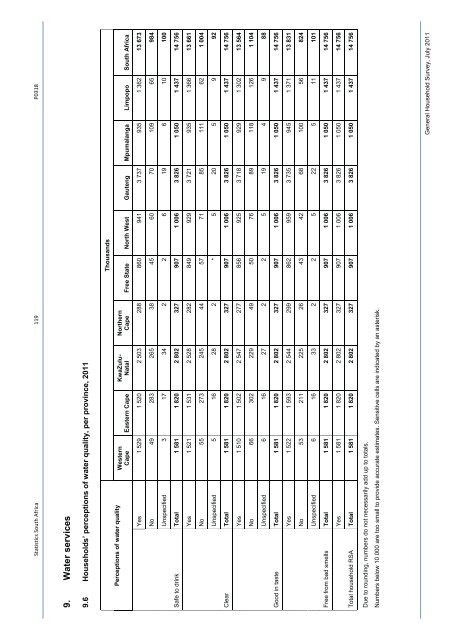
9. Water services<br />
9.6 Households’ perceptions of water quality, per province, 2011<br />
Thousands<br />
Northern<br />
Cape Free State North West Gauteng Mpumalanga Limpopo <strong>South</strong> <strong>Africa</strong><br />
KwaZulu-<br />
Natal<br />
Western<br />
Cape Eastern Cape<br />
Perceptions of water quality<br />
Yes 1 529 1 520 2 503 288 860 941 3 737 935 1 362 13 673<br />
No 49 283 265 38 45 60 70 109 65 984<br />
Unspecified 3 17 34 2 2 6 19 6 10 100<br />
Total 1 581 1 820 2 802 327 907 1 006 3 826 1 050 1 437 14 756<br />
Safe to drink<br />
Yes 1 521 1 531 2 528 282 849 929 3 721 935 1 366 13 661<br />
No 55 273 245 44 57 71 85 111 62 1 004<br />
Unspecified 5 16 28 2 * 5 20 5 9 92<br />
Total 1 581 1 820 2 802 327 907 1 006 3 826 1 050 1 437 14 756<br />
Clear<br />
Yes 1 510 1 502 2 547 277 856 925 3 718 929 1 302 13 564<br />
No 66 302 229 49 50 76 89 118 126 1 104<br />
Unspecified 6 16 27 2 2 5 19 4 9 88<br />
Total 1 581 1 820 2 802 327 907 1 006 3 826 1 050 1 437 14 756<br />
Good in taste<br />
Yes 1 522 1 593 2 544 299 862 959 3 735 945 1 371 13 831<br />
No 53 211 225 26 43 42 68 100 56 824<br />
Unspecified 6 16 33 2 2 5 22 5 11 101<br />
Total 1 581 1 820 2 802 327 907 1 006 3 826 1 050 1 437 14 756<br />
Free from bad smells<br />
Yes 1 581 1 820 2 802 327 907 1 006 3 826 1 050 1 437 14 756<br />
Total 1 581 1 820 2 802 327 907 1 006 3 826 1 050 1 437 14 756<br />
Total <strong>household</strong> RSA<br />
Due to rounding, numbers do not necessarily add up to totals.<br />
Numbers below 10 000 are too small to provide accurate estimates. Sensitive cells are indicated by an asterisk.<br />
<strong>General</strong> Household Survey, July 2011


