

General household survey - Statistics South Africa
General household survey - Statistics South Africa
General household survey - Statistics South Africa

You also want an ePaper? Increase the reach of your titles
YUMPU automatically turns print PDFs into web optimized ePapers that Google loves.
<strong>Statistics</strong> <strong>South</strong> <strong>Africa</strong> 14<br />
P0318<br />
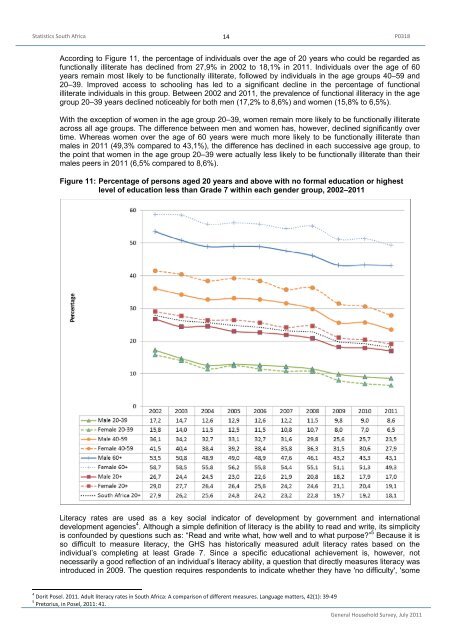
According to Figure 11, the percentage of individuals over the age of 20 years who could be regarded as<br />
functionally illiterate has declined from 27,9% in 2002 to 18,1% in 2011. Individuals over the age of 60<br />
years remain most likely to be functionally illiterate, followed by individuals in the age groups 40–59 and<br />
20–39. Improved access to schooling has led to a significant decline in the percentage of functional<br />
illiterate individuals in this group. Between 2002 and 2011, the prevalence of functional illiteracy in the age<br />
group 20–39 years declined noticeably for both men (17,2% to 8,6%) and women (15,8% to 6,5%).<br />
With the exception of women in the age group 20–39, women remain more likely to be functionally illiterate<br />
across all age groups. The difference between men and women has, however, declined significantly over<br />
time. Whereas women over the age of 60 years were much more likely to be functionally illiterate than<br />
males in 2011 (49,3% compared to 43,1%), the difference has declined in each successive age group, to<br />
the point that women in the age group 20–39 were actually less likely to be functionally illiterate than their<br />
males peers in 2011 (6,5% compared to 8,6%).<br />
Figure 11: Percentage of persons aged 20 years and above with no formal education or highest<br />
level of education less than Grade 7 within each gender group, 2002–2011<br />
Literacy rates are used as a key social indicator of development by government and international<br />
development agencies 4 . Although a simple definition of literacy is the ability to read and write, its simplicity<br />
is confounded by questions such as: “Read and write what, how well and to what purpose?” 5 Because it is<br />
so difficult to measure literacy, the GHS has historically measured adult literacy rates based on the<br />
individual’s completing at least Grade 7. Since a specific educational achievement is, however, not<br />
necessarily a good reflection of an individual’s literacy ability, a question that directly measures literacy was<br />
introduced in 2009. The question requires respondents to indicate whether they have 'no difficulty', 'some<br />
4 Dorit Posel. 2011. Adult literacy rates in <strong>South</strong> <strong>Africa</strong>: A comparison of different measures. Language matters, 42(1): 39-49<br />
5 Pretorius, in Posel, 2011: 41.<br />
<strong>General</strong> Household Survey, July 2011


