

General household survey - Statistics South Africa
General household survey - Statistics South Africa
General household survey - Statistics South Africa

Create successful ePaper yourself
Turn your PDF publications into a flip-book with our unique Google optimized e-Paper software.
<strong>Statistics</strong> <strong>South</strong> <strong>Africa</strong> 115<br />
P0318<br />
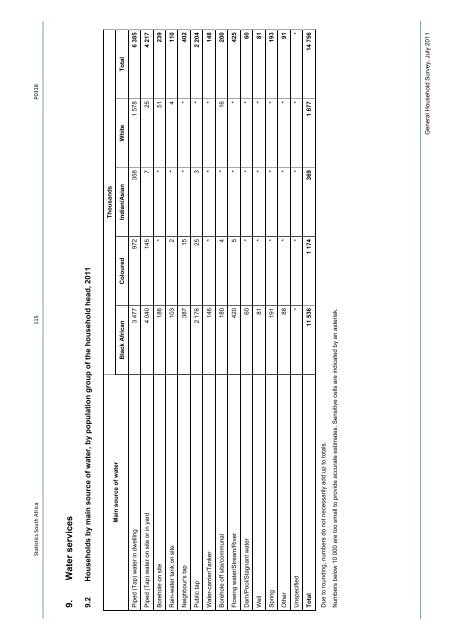
9. Water services<br />
9.2 Households by main source of water, by population group of the <strong>household</strong> head, 2011<br />
Thousands<br />
Main source of water<br />
Black <strong>Africa</strong>n Coloured Indian/Asian White Total<br />
Piped (Tap) water in dwelling 3 477 972 358 1 578 6 385<br />
Piped (Tap) water on site or in yard 4 040 145 7 25 4 217<br />
Borehole on site 186 * * 51 239<br />
Rain-water tank on site 103 2 * 4 110<br />
Neighbour's tap 387 15 * * 402<br />
Public tap 2 176 25 3 * 2 204<br />
Water-carrier/Tanker 146 * * * 148<br />
Borehole off site/communal 180 4 * 16 200<br />
Flowing water/Stream/River 420 5 * * 425<br />
Dam/Pool/Stagnant water 60 * * * 60<br />
Well 81 * * * 81<br />
Spring 191 * * * 193<br />
Other 88 * * * 91<br />
Unspecified * * * * *<br />
Total 11 536 1 174 369 1 677 14 756<br />
Due to rounding, numbers do not necessarily add up to totals.<br />
Numbers below 10 000 are too small to provide accurate estimates. Sensitive cells are indicated by an asterisk.<br />
<strong>General</strong> Household Survey, July 2011


