

General household survey - Statistics South Africa
General household survey - Statistics South Africa
General household survey - Statistics South Africa

You also want an ePaper? Increase the reach of your titles
YUMPU automatically turns print PDFs into web optimized ePapers that Google loves.
<strong>Statistics</strong> <strong>South</strong> <strong>Africa</strong> 146<br />
P0318<br />
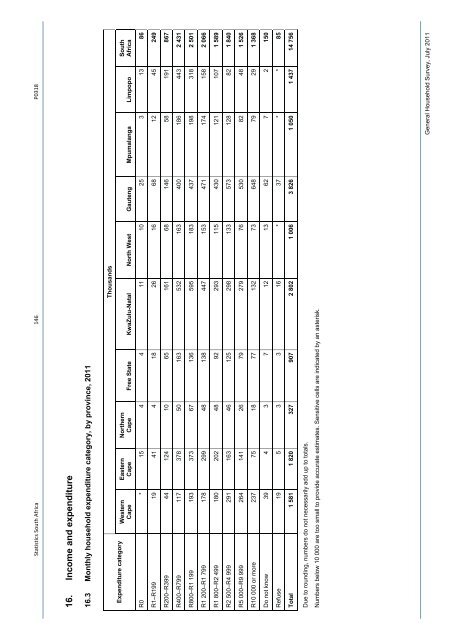
16. Income and expenditure<br />
16.3 Monthly <strong>household</strong> expenditure category, by province, 2011<br />
Thousands<br />
<strong>South</strong><br />
<strong>Africa</strong><br />
Northern<br />
Cape Free State KwaZulu-Natal North West Gauteng Mpumalanga Limpopo<br />
Eastern<br />
Cape<br />
Western<br />
Cape<br />
Expenditure category<br />
R0 * 15 4 4 11 10 25 3 13 86<br />
R1–R199 19 41 4 18 26 16 68 12 45 249<br />
R200–R399 44 124 10 65 161 68 146 58 191 867<br />
R400–R799 117 378 50 163 532 163 400 186 443 2 431<br />
R800–R1 199 193 373 67 136 595 183 437 198 318 2 501<br />
R1 200–R1 799 178 299 48 138 447 153 471 174 158 2 066<br />
R1 800–R2 499 180 202 48 92 293 115 430 121 107 1 589<br />
R2 500–R4 999 291 163 46 125 298 133 573 128 82 1 840<br />
R5 000–R9 999 264 141 26 79 279 76 530 82 48 1 526<br />
R10 000 or more 237 75 18 77 132 73 648 79 29 1 368<br />
Do not know 39 4 3 7 12 13 62 7 2 150<br />
Refuse 19 5 3 3 16 * 37 * * 85<br />
Total 1 581 1 820 327 907 2 802 1 006 3 826 1 050 1 437 14 756<br />
Due to rounding, numbers do not necessarily add up to totals.<br />
Numbers below 10 000 are too small to provide accurate estimates. Sensitive cells are indicated by an asterisk.<br />
<strong>General</strong> Household Survey, July 2011


