

General household survey - Statistics South Africa
General household survey - Statistics South Africa
General household survey - Statistics South Africa

Create successful ePaper yourself
Turn your PDF publications into a flip-book with our unique Google optimized e-Paper software.
<strong>Statistics</strong> <strong>South</strong> <strong>Africa</strong> 95<br />
P0318<br />
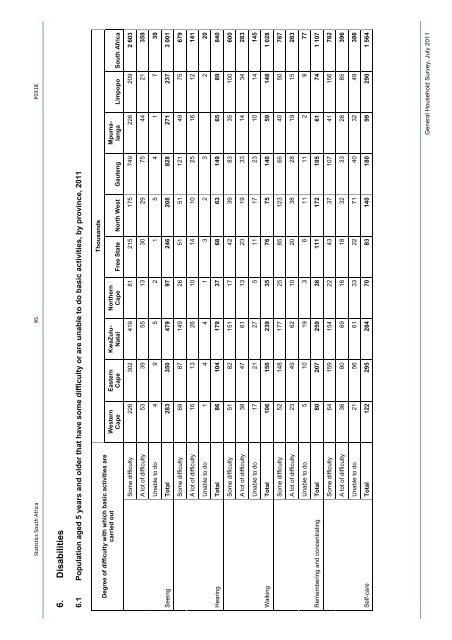
6. Disabilities<br />
6.1 Population aged 5 years and older that have some difficulty or are unable to do basic activities, by province, 2011<br />
Thousands<br />
Mpumalanga<br />
Limpopo <strong>South</strong> <strong>Africa</strong><br />
Northern<br />
Cape Free State North West Gauteng<br />
KwaZulu-<br />
Natal<br />
Eastern<br />
Cape<br />
Western<br />
Cape<br />
Degree of difficulty with which basic activities are<br />
carried out<br />
Some difficulty 226 302 419 81 215 175 749 226 209 2 603<br />
A lot of difficulty 53 39 55 13 30 29 75 44 21 359<br />
Unable to do 4 9 5 2 1 5 4 1 7 39<br />
Total 283 350 479 97 246 208 828 271 237 3 001<br />
Seeing<br />
Some difficulty 69 87 149 26 51 51 121 49 75 679<br />
A lot of difficulty 16 13 26 10 14 10 25 16 12 141<br />
Unable to do 1 4 4 1 3 2 3 2 20<br />
Total 86 104 179 37 68 63 149 65 89 840<br />
Hearing<br />
Some difficulty 51 82 151 17 42 39 83 35 100 600<br />
A lot of difficulty 38 47 61 13 23 19 33 14 34 283<br />
Unable to do 17 21 27 5 11 17 23 10 14 145<br />
Total 106 150 239 35 76 75 140 59 148 1 028<br />
Walking<br />
Some difficulty 52 148 177 25 85 123 66 40 50 767<br />
A lot of difficulty 23 49 62 10 20 38 28 19 15 263<br />
Unable to do 5 10 19 3 6 11 11 2 9 77<br />
Total 80 207 259 38 111 172 105 61 74 1 107<br />
Remembering and concentrating<br />
Some difficulty 64 159 154 22 43 37 107 41 156 782<br />
A lot of difficulty 36 80 69 16 18 32 33 26 85 396<br />
Unable to do 21 56 61 33 22 71 40 32 49 386<br />
Total 122 295 284 70 83 140 180 99 290 1 564<br />
Self-care<br />
<strong>General</strong> Household Survey, July 2011


