

General household survey - Statistics South Africa
General household survey - Statistics South Africa
General household survey - Statistics South Africa

Create successful ePaper yourself
Turn your PDF publications into a flip-book with our unique Google optimized e-Paper software.
<strong>Statistics</strong> <strong>South</strong> <strong>Africa</strong> 55<br />
P0318<br />
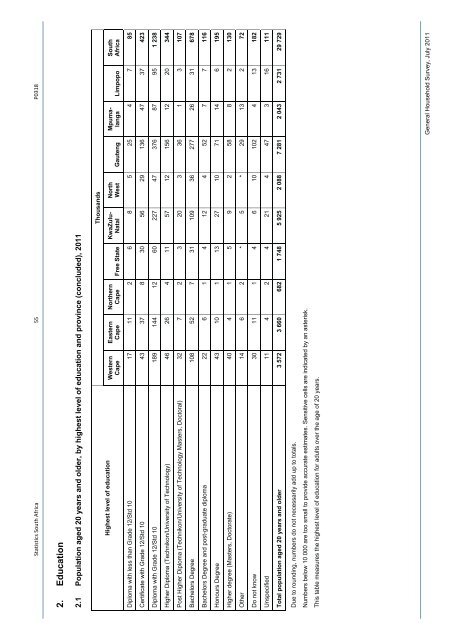
2. Education<br />
2.1 Population aged 20 years and older, by highest level of education and province (concluded), 2011<br />
Thousands<br />
<strong>South</strong><br />
<strong>Africa</strong><br />
Mpumalanga<br />
Limpopo<br />
North<br />
West Gauteng<br />
KwaZulu-<br />
Natal<br />
Northern<br />
Cape Free State<br />
Eastern<br />
Cape<br />
Western<br />
Cape<br />
Highest level of education<br />
Diploma with less than Grade 12/Std 10 17 11 2 6 8 5 25 4 7 85<br />
Certificate with Grade 12/Std 10 43 37 8 30 56 29 136 47 37 423<br />
Diploma with Grade 12/Std 10 189 144 12 60 227 47 376 87 95 1 238<br />
Higher Diploma (Technikon/University of Technology) 46 26 4 11 57 12 156 12 20 344<br />
Post Higher Diploma (Technikon/University of Technology Masters, Doctoral) 32 7 2 3 20 3 36 1 3 107<br />
Bachelors Degree 108 52 7 31 109 36 277 26 31 678<br />
Bachelors Degree and post-graduate diploma 22 6 1 4 12 4 52 7 7 116<br />
Honours Degree 43 10 1 13 27 10 71 14 6 195<br />
Higher degree (Masters, Doctorate) 40 4 1 5 9 2 58 8 2 130<br />
Other 14 6 2 * 5 * 29 13 2 72<br />
Do not know 30 11 1 4 6 10 102 4 13 182<br />
Unspecified 11 4 2 4 21 4 47 3 16 111<br />
Total population aged 20 years and older 3 572 3 660 682 1 748 5 925 2 088 7 281 2 043 2 731 29 729<br />
Due to rounding, numbers do not necessarily add up to totals.<br />
Numbers below 10 000 are too small to provide accurate estimates. Sensitive cells are indicated by an asterisk.<br />
This table measures the highest level of education for adults over the age of 20 years.<br />
<strong>General</strong> Household Survey, July 2011


