

General household survey - Statistics South Africa
General household survey - Statistics South Africa
General household survey - Statistics South Africa

You also want an ePaper? Increase the reach of your titles
YUMPU automatically turns print PDFs into web optimized ePapers that Google loves.
<strong>Statistics</strong> <strong>South</strong> <strong>Africa</strong> 127<br />
P0318<br />
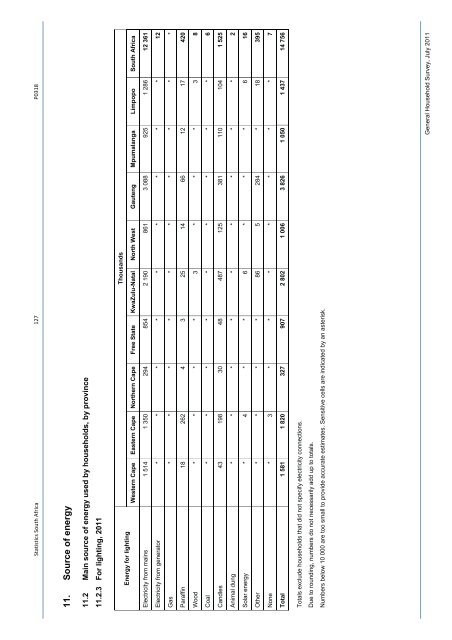
11. Source of energy<br />
11.2 Main source of energy used by <strong>household</strong>s, by province<br />
11.2.3 For lighting, 2011<br />
Thousands<br />
Energy for lighting<br />
Western Cape Eastern Cape Northern Cape Free State KwaZulu-Natal North West Gauteng Mpumalanga Limpopo <strong>South</strong> <strong>Africa</strong><br />
Electricity from mains 1 514 1 350 294 854 2 190 861 3 088 925 1 286 12 361<br />
Electricity from generator * * * * * * * * * 12<br />
Gas * * * * * * * * * *<br />
Paraffin 18 262 4 3 25 14 66 12 17 420<br />
Wood * * * * 3 * * * 3 8<br />
Coal * * * * * * * * * 6<br />
Candles 43 198 30 48 487 125 381 110 104 1 525<br />
Animal dung * * * * * * * * * 2<br />
Solar energy * 4 * * 6 * * * 6 16<br />
Other * * * * 86 5 284 * 18 395<br />
None * 3 * * * * * * * 7<br />
Total 1 581 1 820 327 907 2 802 1 006 3 826 1 050 1 437 14 756<br />
Totals exclude <strong>household</strong>s that did not specify electricity connections.<br />
Due to rounding, numbers do not necessarily add up to totals.<br />
Numbers below 10 000 are too small to provide accurate estimates. Sensitive cells are indicated by an asterisk.<br />
<strong>General</strong> Household Survey, July 2011


