

General household survey - Statistics South Africa
General household survey - Statistics South Africa
General household survey - Statistics South Africa

You also want an ePaper? Increase the reach of your titles
YUMPU automatically turns print PDFs into web optimized ePapers that Google loves.
<strong>Statistics</strong> <strong>South</strong> <strong>Africa</strong> 144<br />
P0318<br />
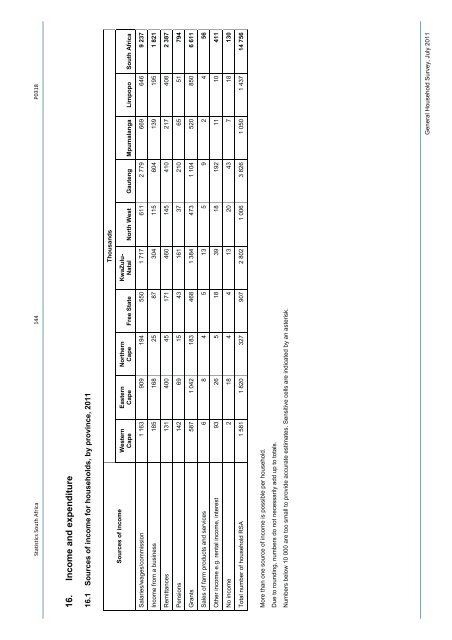
16. Income and expenditure<br />
16.1 Sources of income for <strong>household</strong>s, by province, 2011<br />
Thousands<br />
KwaZulu-<br />
Natal North West Gauteng Mpumalanga Limpopo <strong>South</strong> <strong>Africa</strong><br />
Northern<br />
Cape Free State<br />
Eastern<br />
Cape<br />
Western<br />
Cape<br />
Sources of income<br />
Salaries/wages/commission 1 163 909 194 550 1 717 611 2 779 669 646 9 237<br />
Income from a business 185 168 25 87 304 115 604 139 195 1 821<br />
Remittances 131 400 45 171 460 145 410 217 408 2 387<br />
Pensions 142 69 15 43 161 37 210 65 51 794<br />
Grants 587 1 042 183 468 1 384 473 1 104 520 850 6 611<br />
Sales of farm products and services 6 8 4 5 13 5 9 2 4 56<br />
Other income e.g. rental income, interest 93 26 5 18 39 18 192 11 10 411<br />
No income 2 18 4 4 13 20 43 7 18 130<br />
Total number of <strong>household</strong> RSA 1 581 1 820 327 907 2 802 1 006 3 826 1 050 1 437 14 756<br />
More than one source of income is possible per <strong>household</strong>.<br />
Due to rounding, numbers do not necessarily add up to totals.<br />
Numbers below 10 000 are too small to provide accurate estimates. Sensitive cells are indicated by an asterisk.<br />
<strong>General</strong> Household Survey, July 2011


