

General household survey - Statistics South Africa
General household survey - Statistics South Africa
General household survey - Statistics South Africa

Create successful ePaper yourself
Turn your PDF publications into a flip-book with our unique Google optimized e-Paper software.
<strong>Statistics</strong> <strong>South</strong> <strong>Africa</strong> 38<br />
P0318<br />
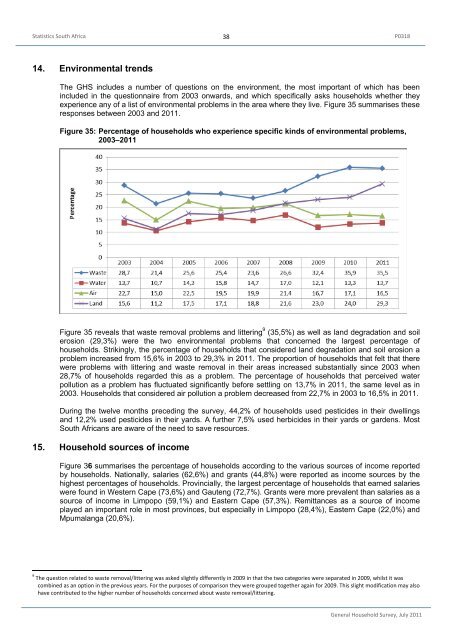
14. Environmental trends<br />
The GHS includes a number of questions on the environment, the most important of which has been<br />
included in the questionnaire from 2003 onwards, and which specifically asks <strong>household</strong>s whether they<br />
experience any of a list of environmental problems in the area where they live. Figure 35 summarises these<br />
responses between 2003 and 2011.<br />
Figure 35: Percentage of <strong>household</strong>s who experience specific kinds of environmental problems,<br />
2003–2011<br />
Figure 35 reveals that waste removal problems and littering 9 (35,5%) as well as land degradation and soil<br />
erosion (29,3%) were the two environmental problems that concerned the largest percentage of<br />
<strong>household</strong>s. Strikingly, the percentage of <strong>household</strong>s that considered land degradation and soil erosion a<br />
problem increased from 15,6% in 2003 to 29,3% in 2011. The proportion of <strong>household</strong>s that felt that there<br />
were problems with littering and waste removal in their areas increased substantially since 2003 when<br />
28,7% of <strong>household</strong>s regarded this as a problem. The percentage of <strong>household</strong>s that perceived water<br />
pollution as a problem has fluctuated significantly before settling on 13,7% in 2011, the same level as in<br />
2003. Households that considered air pollution a problem decreased from 22,7% in 2003 to 16,5% in 2011.<br />
During the twelve months preceding the <strong>survey</strong>, 44,2% of <strong>household</strong>s used pesticides in their dwellings<br />
and 12,2% used pesticides in their yards. A further 7,5% used herbicides in their yards or gardens. Most<br />
<strong>South</strong> <strong>Africa</strong>ns are aware of the need to save resources.<br />
15. Household sources of income<br />
Figure 36 summarises the percentage of <strong>household</strong>s according to the various sources of income reported<br />
by <strong>household</strong>s. Nationally, salaries (62,6%) and grants (44,8%) were reported as income sources by the<br />
highest percentages of <strong>household</strong>s. Provincially, the largest percentage of <strong>household</strong>s that earned salaries<br />
were found in Western Cape (73,6%) and Gauteng (72,7%). Grants were more prevalent than salaries as a<br />
source of income in Limpopo (59,1%) and Eastern Cape (57,3%). Remittances as a source of income<br />
played an important role in most provinces, but especially in Limpopo (28,4%), Eastern Cape (22,0%) and<br />
Mpumalanga (20,6%).<br />
9 The question related to waste removal/littering was asked slightly differently in 2009 in that the two categories were separated in 2009, whilst it was<br />
combined as an option in the previous years. For the purposes of comparison they were grouped together again for 2009. This slight modification may also<br />
have contributed to the higher number of <strong>household</strong>s concerned about waste removal/littering.<br />
<strong>General</strong> Household Survey, July 2011


