

General household survey - Statistics South Africa
General household survey - Statistics South Africa
General household survey - Statistics South Africa

You also want an ePaper? Increase the reach of your titles
YUMPU automatically turns print PDFs into web optimized ePapers that Google loves.
<strong>Statistics</strong> <strong>South</strong> <strong>Africa</strong> 125<br />
P0318<br />
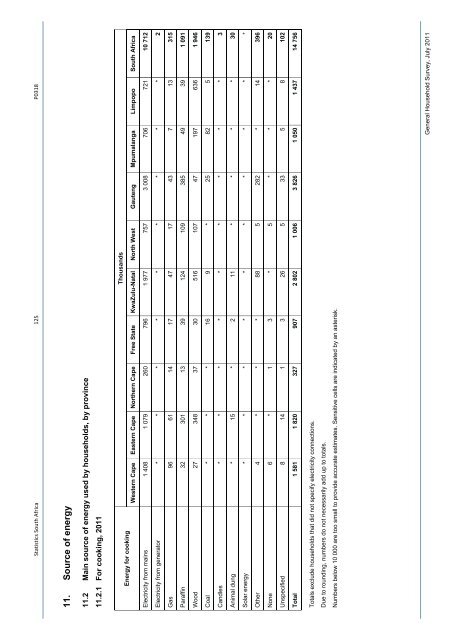
11. Source of energy<br />
11.2 Main source of energy used by <strong>household</strong>s, by province<br />
11.2.1 For cooking, 2011<br />
Thousands<br />
Energy for cooking<br />
Western Cape Eastern Cape Northern Cape Free State KwaZulu-Natal North West Gauteng Mpumalanga Limpopo <strong>South</strong> <strong>Africa</strong><br />
Electricity from mains 1 408 1 079 260 796 1 977 757 3 008 706 721 10 712<br />
Electricity from generator * * * * * * * * * 2<br />
Gas 96 61 14 17 47 17 43 7 13 315<br />
Paraffin 32 301 13 39 124 109 385 49 39 1 091<br />
Wood 27 348 37 30 516 107 47 197 636 1 946<br />
Coal * * * 16 9 * 25 82 5 139<br />
Candles * * * * * * * * * 3<br />
Animal dung * 15 * 2 11 * * * * 30<br />
Solar energy * * * * * * * * * *<br />
Other 4 * * * 88 5 282 * 14 396<br />
None 6 * 1 3 * 5 * * * 20<br />
Unspecified 8 14 1 3 26 5 33 5 8 102<br />
Total 1 581 1 820 327 907 2 802 1 006 3 826 1 050 1 437 14 756<br />
Totals exclude <strong>household</strong>s that did not specify electricity connections.<br />
Due to rounding, numbers do not necessarily add up to totals.<br />
Numbers below 10 000 are too small to provide accurate estimates. Sensitive cells are indicated by an asterisk.<br />
<strong>General</strong> Household Survey, July 2011


