

General household survey - Statistics South Africa
General household survey - Statistics South Africa
General household survey - Statistics South Africa

You also want an ePaper? Increase the reach of your titles
YUMPU automatically turns print PDFs into web optimized ePapers that Google loves.
<strong>Statistics</strong> <strong>South</strong> <strong>Africa</strong> 124<br />
P0318<br />
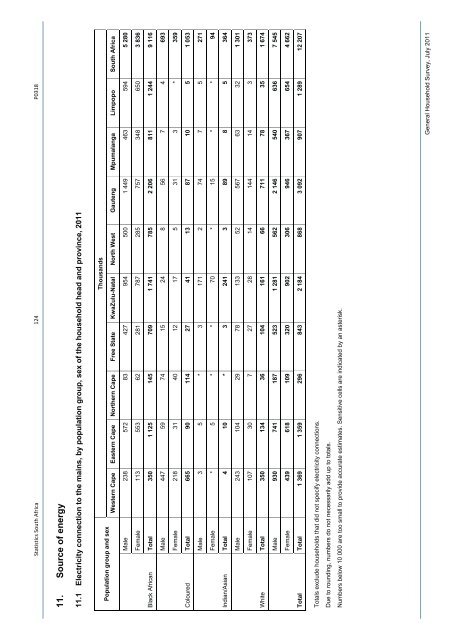
11. Source of energy<br />
11.1 Electricity connection to the mains, by population group, sex of the <strong>household</strong> head and province, 2011<br />
Thousands<br />
Population group and sex<br />
Western Cape Eastern Cape Northern Cape Free State KwaZulu-Natal North West Gauteng Mpumalanga Limpopo <strong>South</strong> <strong>Africa</strong><br />
Male 238 572 83 427 954 500 1 449 463 594 5 280<br />
Female 113 553 62 281 787 285 757 348 650 3 836<br />
Total 350 1 125 145 709 1 741 785 2 206 811 1 244 9 116<br />
Black <strong>Africa</strong>n<br />
Male 447 59 74 15 24 8 56 7 4 693<br />
Female 218 31 40 12 17 5 31 3 * 359<br />
Total 665 90 114 27 41 13 87 10 5 1 053<br />
Coloured<br />
Male 3 5 * 3 171 2 74 7 5 271<br />
Female * 5 * * 70 * 15 * * 94<br />
Total 4 10 * 3 241 3 89 8 5 364<br />
Indian/Asian<br />
Male 243 104 29 78 133 52 567 63 32 1 301<br />
Female 107 30 7 27 28 14 144 14 3 373<br />
Total 350 134 36 104 161 66 711 78 35 1 674<br />
White<br />
Male 930 741 187 523 1 281 562 2 146 540 636 7 545<br />
Female 439 618 109 320 902 306 946 367 654 4 662<br />
Total 1 369 1 359 296 843 2 184 868 3 092 907 1 289 12 207<br />
Total<br />
Totals exclude <strong>household</strong>s that did not specify electricity connections.<br />
Due to rounding, numbers do not necessarily add up to totals.<br />
Numbers below 10 000 are too small to provide accurate estimates. Sensitive cells are indicated by an asterisk.<br />
<strong>General</strong> Household Survey, July 2011


