

General household survey - Statistics South Africa
General household survey - Statistics South Africa
General household survey - Statistics South Africa

You also want an ePaper? Increase the reach of your titles
YUMPU automatically turns print PDFs into web optimized ePapers that Google loves.
<strong>Statistics</strong> <strong>South</strong> <strong>Africa</strong> 63<br />
P0318<br />
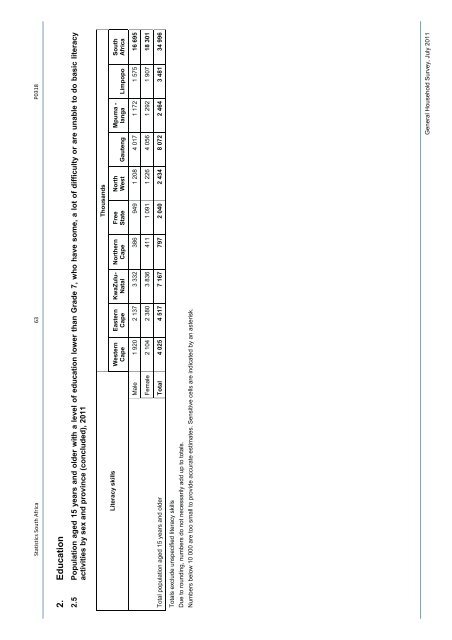
2. Education<br />
2.5 Population aged 15 years and older with a level of education lower than Grade 7, who have some, a lot of difficulty or are unable to do basic literacy<br />
activities by sex and province (concluded), 2011<br />
Thousands<br />
<strong>South</strong><br />
<strong>Africa</strong><br />
Mpuma -<br />
langa Limpopo<br />
North<br />
West Gauteng<br />
Free<br />
State<br />
Northern<br />
Cape<br />
KwaZulu-<br />
Natal<br />
Eastern<br />
Cape<br />
Western<br />
Cape<br />
Literacy skills<br />
Male 1 920 2 137 3 332 386 949 1 208 4 017 1 172 1 575 16 695<br />
Female 2 104 2 380 3 836 411 1 091 1 226 4 056 1 292 1 907 18 301<br />
Total 4 025 4 517 7 167 797 2 040 2 434 8 072 2 464 3 481 34 996<br />
Total population aged 15 years and older<br />
Totals exclude unspecified literacy skills<br />
Due to rounding, numbers do not necessarily add up to totals.<br />
Numbers below 10 000 are too small to provide accurate estimates. Sensitive cells are indicated by an asterisk.<br />
<strong>General</strong> Household Survey, July 2011


