

General household survey - Statistics South Africa
General household survey - Statistics South Africa
General household survey - Statistics South Africa

You also want an ePaper? Increase the reach of your titles
YUMPU automatically turns print PDFs into web optimized ePapers that Google loves.
<strong>Statistics</strong> <strong>South</strong> <strong>Africa</strong> 114<br />
P0318<br />
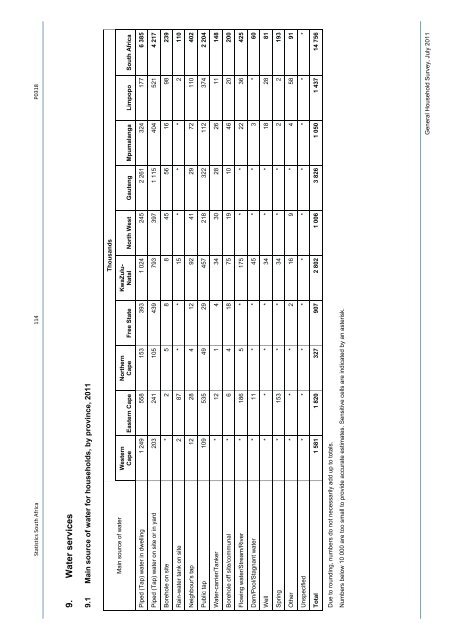
9. Water services<br />
9.1 Main source of water for <strong>household</strong>s, by province, 2011<br />
Thousands<br />
KwaZulu-<br />
Natal North West Gauteng Mpumalanga Limpopo <strong>South</strong> <strong>Africa</strong><br />
Northern<br />
Cape Free State<br />
Western<br />
Cape Eastern Cape<br />
Main source of water<br />
Piped (Tap) water in dwelling 1 249 558 153 393 1 024 245 2 261 324 177 6 385<br />
Piped (Tap) water on site or in yard 203 241 105 439 793 397 1 115 404 521 4 217<br />
Borehole on site * 2 5 8 8 45 56 16 98 239<br />
Rain-water tank on site 2 87 * * 15 * * * 2 110<br />
Neighbour's tap 12 28 4 12 92 41 29 72 110 402<br />
Public tap 109 535 49 29 457 218 322 112 374 2 204<br />
Water-carrier/Tanker * 12 1 4 34 30 28 26 11 148<br />
Borehole off site/communal * 6 4 18 75 19 10 46 20 200<br />
Flowing water/Stream/River * 186 5 * 175 * * 22 36 425<br />
Dam/Pool/Stagnant water * 11 * * 45 * * 3 * 60<br />
Well * * * * 34 * * 18 28 81<br />
Spring * 153 * * 34 * * 2 2 193<br />
Other * * * 2 16 9 * 4 58 91<br />
Unspecified * * * * * * * * * *<br />
Total 1 581 1 820 327 907 2 802 1 006 3 826 1 050 1 437 14 756<br />
Due to rounding, numbers do not necessarily add up to totals.<br />
Numbers below 10 000 are too small to provide accurate estimates. Sensitive cells are indicated by an asterisk.<br />
<strong>General</strong> Household Survey, July 2011


