

General household survey - Statistics South Africa
General household survey - Statistics South Africa
General household survey - Statistics South Africa

Create successful ePaper yourself
Turn your PDF publications into a flip-book with our unique Google optimized e-Paper software.
<strong>Statistics</strong> <strong>South</strong> <strong>Africa</strong> 61<br />
P0318<br />
2. Education<br />
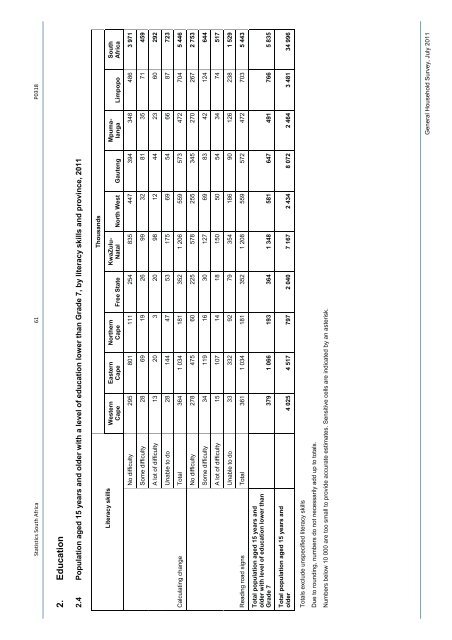
2.4 Population aged 15 years and older with a level of education lower than Grade 7, by literacy skills and province, 2011<br />
Thousands<br />
<strong>South</strong><br />
<strong>Africa</strong><br />
Mpumalanga<br />
Limpopo<br />
KwaZulu-<br />
Natal North West Gauteng<br />
Northern<br />
Cape Free State<br />
Eastern<br />
Cape<br />
Western<br />
Cape<br />
Literacy skills<br />
No difficulty 295 801 111 254 835 447 394 348 486 3 971<br />
Some difficulty 28 69 19 26 99 32 81 35 71 459<br />
A lot of difficulty 13 20 3 20 98 12 44 23 60 292<br />
Unable to do 28 144 47 53 175 69 54 66 87 723<br />
Total 364 1 034 181 352 1 206 559 573 472 704 5 446<br />
Calculating change<br />
No difficulty 278 475 60 225 578 255 345 270 267 2 753<br />
Some difficulty 34 119 16 30 127 69 83 42 124 644<br />
A lot of difficulty 15 107 14 18 150 50 54 34 74 517<br />
Unable to do 33 332 92 79 354 186 90 126 238 1 529<br />
Total 361 1 034 181 352 1 208 559 572 472 703 5 443<br />
Reading road signs<br />
Total population aged 15 years and<br />
older with level of education lower than<br />
Grade 7 379 1 066 193 364 1 348 581 647 491 766 5 835<br />
Total population aged 15 years and<br />
older 4 025 4 517 797 2 040 7 167 2 434 8 072 2 464 3 481 34 996<br />
Totals exclude unspecified literacy skills<br />
Due to rounding, numbers do not necessarily add up to totals.<br />
Numbers below 10 000 are too small to provide accurate estimates. Sensitive cells are indicated by an asterisk.<br />
<strong>General</strong> Household Survey, July 2011


